
RouteXL
RouteXL is an add-in to SpatialXL that allows optimised routing, transportation scheduling and high-speed bulk routing operations.

Point to Point Routing

How to set up your data
❖Load your Routing Network by browsing to your .routingDB file. Your Routing Network will be displayed in the bottom right corner of your RouteXL window. I loaded newzafza.routingDB which is the South African Routing Network.
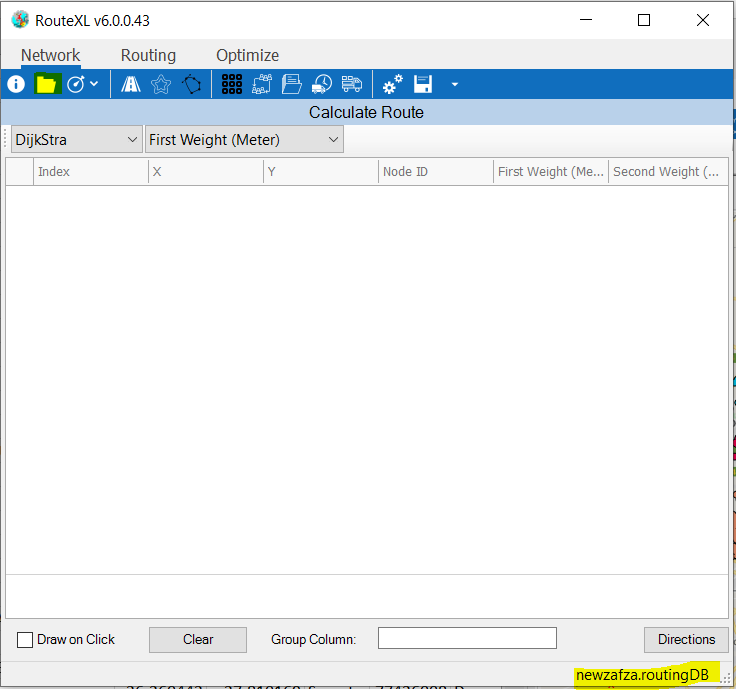
❖DijkStra above is the default routing algorithm.
❖You can either optimize your route by First Weight (Meter) or Second Weight (Minute). I have chosen Second Weight (Minute)

Inputting your data
❖You have an option of Draw on Click. Make sure it is ticked on.

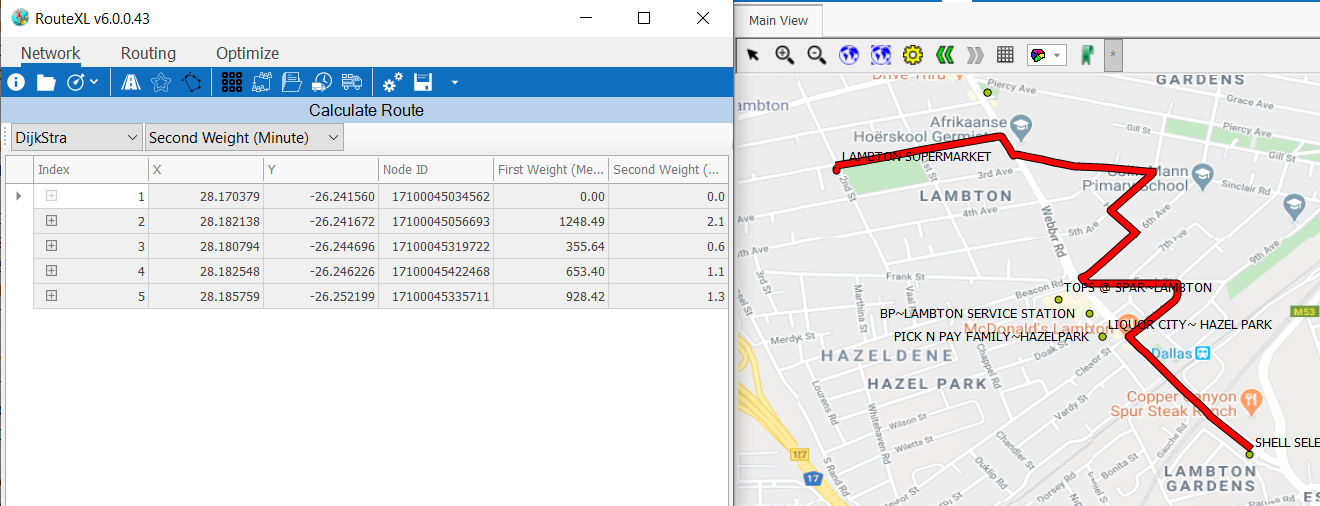
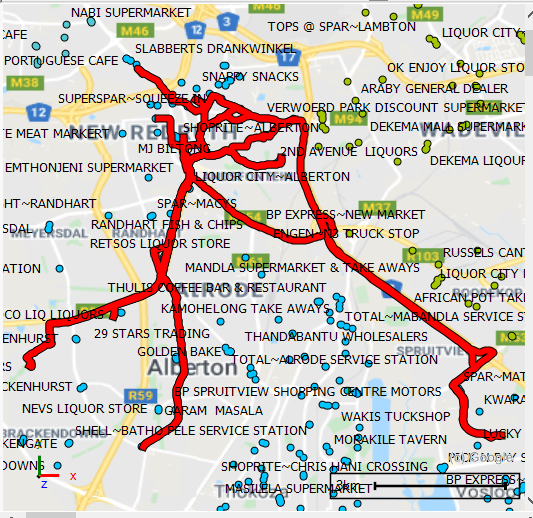
❖Select your first point by clicking on any area on your map you would like to start to draw your route from – I chose from Lambton Supermarket. Your point on your map will be displayed in red. A layer Route has also been added to your Layer Description.

❖Continue clicking until your desired route is drawn.
❖Alternatively, you can select data from your Excel spreadsheet that you would like to route in the sequence that it is in the rows. (There is also an option to route your data in terms of groups which I’ve used in this example.)
❖Type in the Group Column name first in the RouteXL window, otherwise leave it blank if you are not grouping.
![]()
❖Simply copy and paste this data into your RouteXL window.
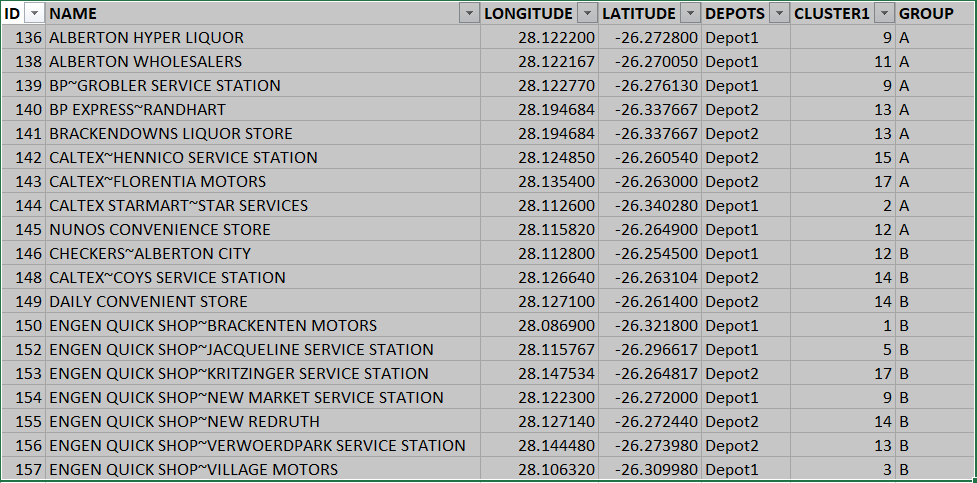
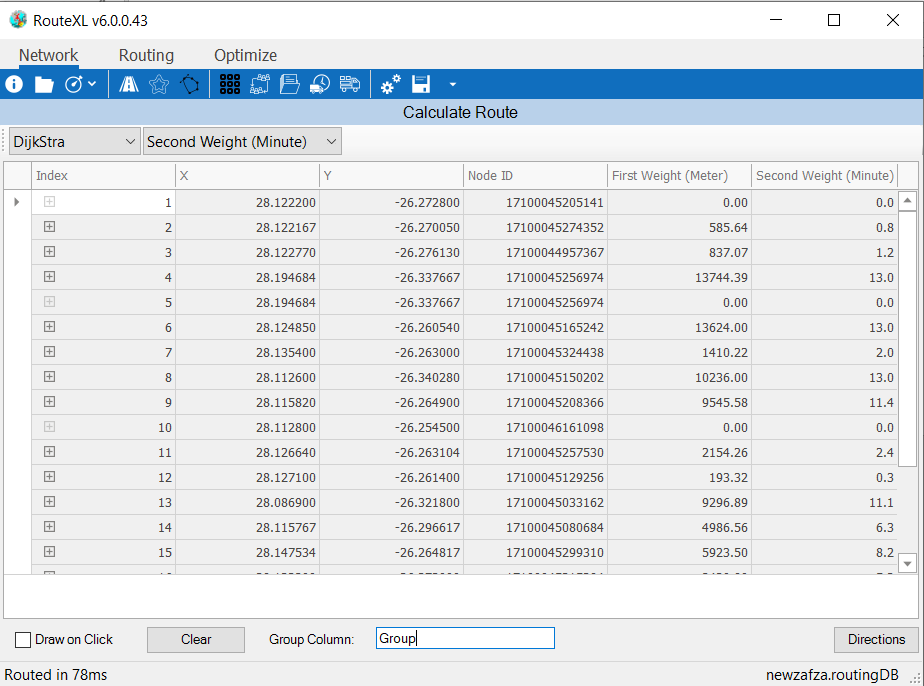
❖Your routes again will be displayed on your map.
Understanding your data

❖This is the first point that is selected on your map from Draw on Click, or the first point that is in the data you copied and pasted from your Excel worksheet.

❖The subsequent Indexes are each separate click that is made on your map or next points in your rows of data that has been copied from your Excel worksheet. You can see the distance (First Weight) and time (Second Weight) from each subsequent point.
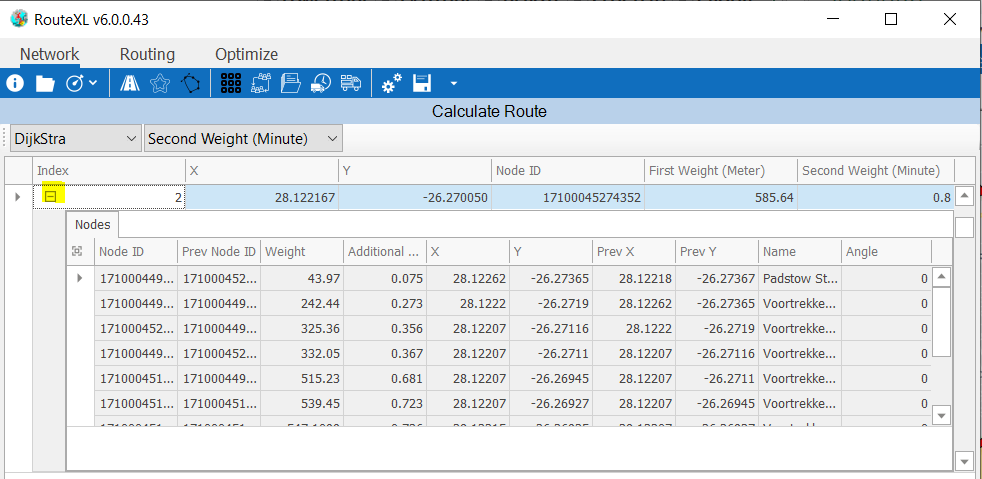
❖Expand an Index by clicking the plus symbol to the left of it. In this case in Index 2 above there is a minus symbol because I have expanded it. You will see all the Nodes along this specific route with attribute information.
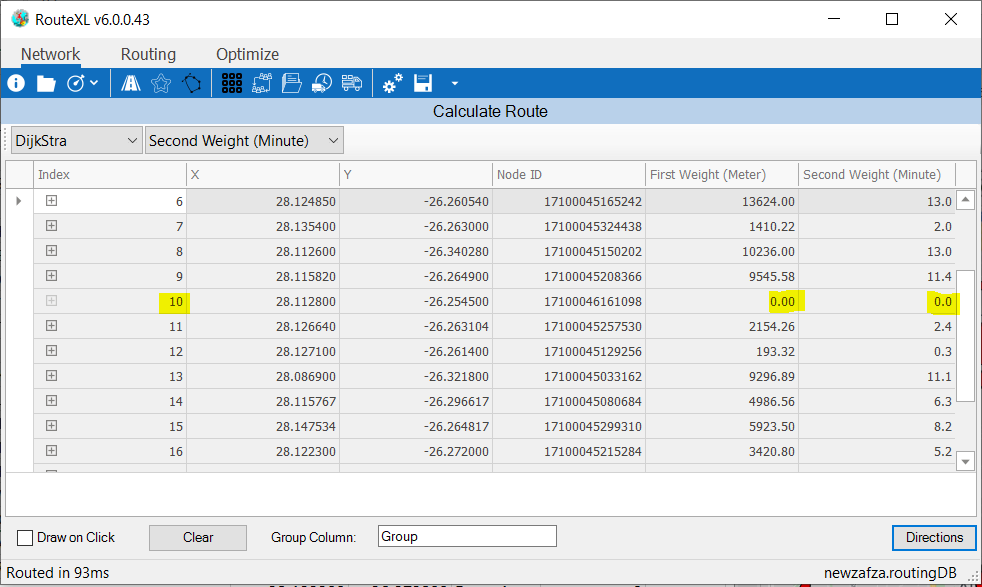
❖If you have grouped your routes as I have you will see this evident in your RouteXL window. All Indexes from Index to Index there are times and distances. From Index 10 above, your next group starts again from 0 time and distance then onto the next Indexes with the appropriate times and distances.
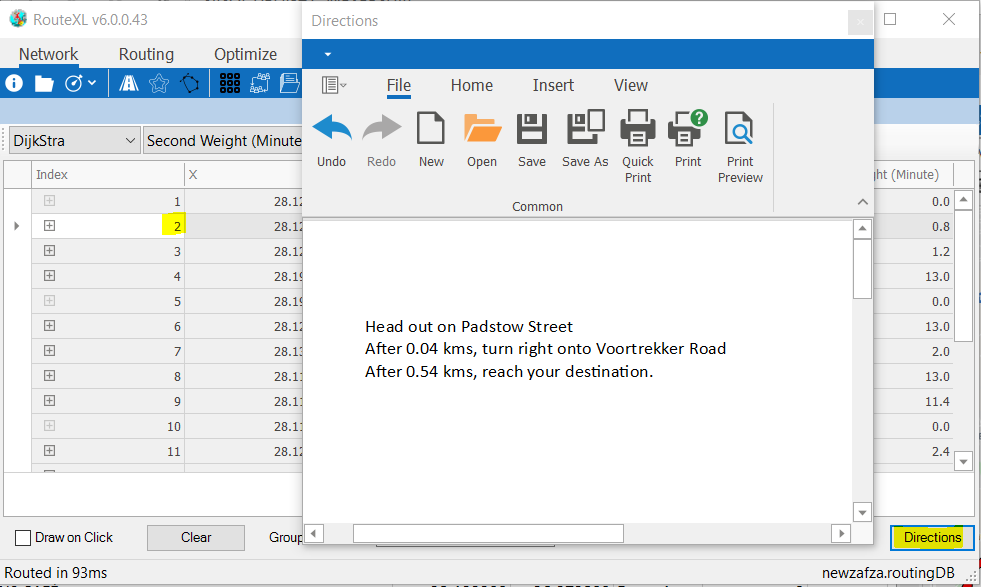
❖You can see the directions for each route by selecting an Index, then clicking Directions. You can copy and paste this data etc if needed.

❖Routed in 93ms means how long the system took to find a solution for what you have inputted. In this example it took 93 milliseconds to solve.
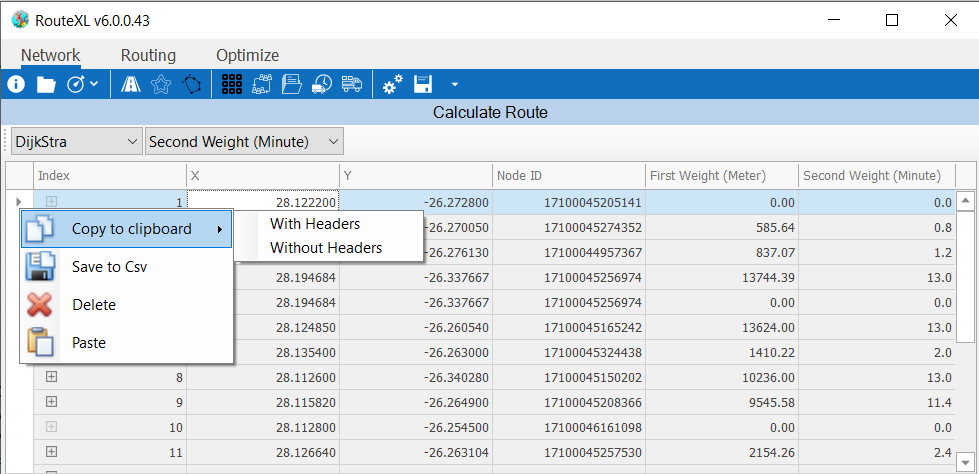
❖You can copy or save this data for future reference and analysis.
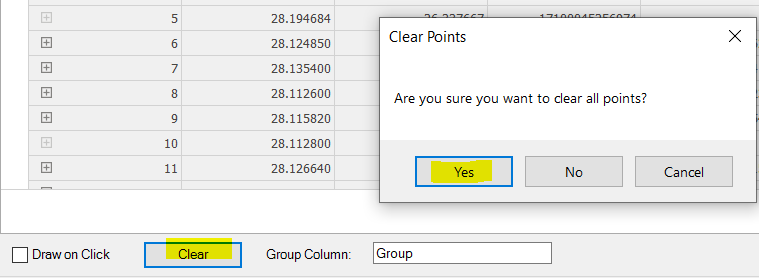
❖If you need to clear your points and start again, click Clear and then Yes.
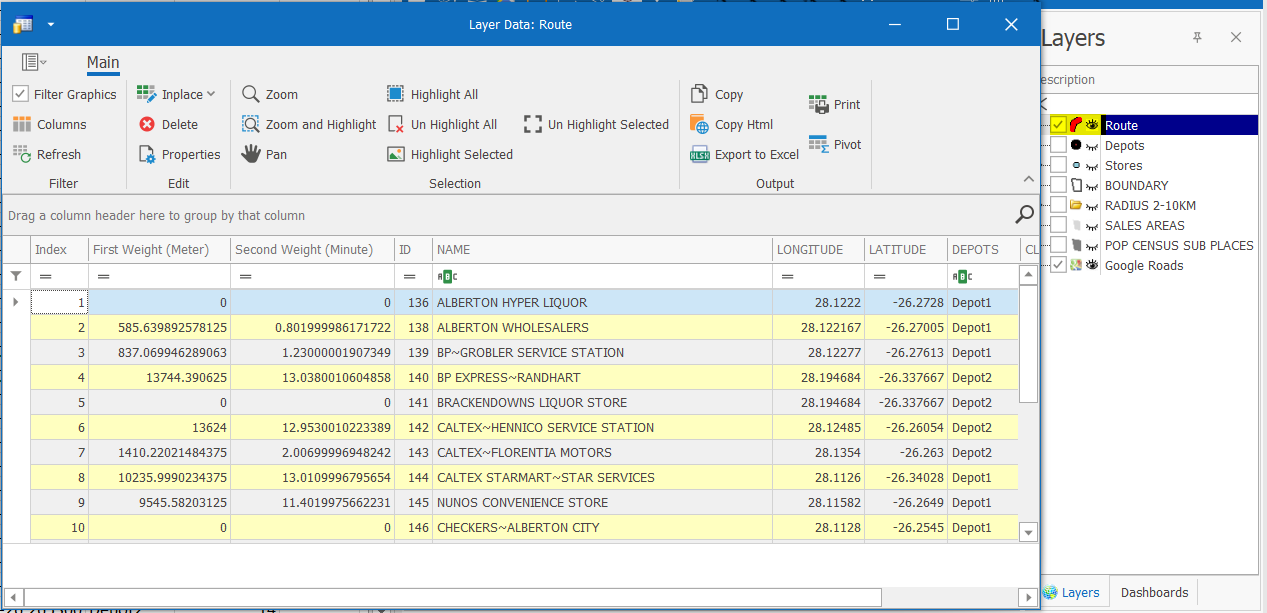
❖You can also view your data in the Layer Data grid.
Support
|
||||||
|
T: +27871354351
|
|||||
