
Quantitive Vehicle Routing
❖Quantitive Vehicle Routing is a feature in RouteXL where you can optimize vehicle delivery based on demands and capacities of vehicles.

❖Load your Routing Network as the first step.

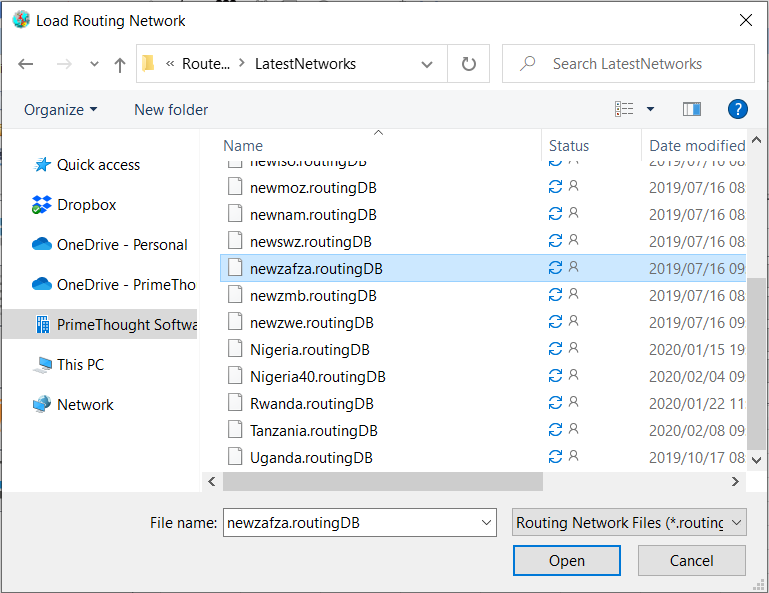
❖Browse to where your Routing Network is saved. In this example I’m loading the South African Routing Network.
❖You will see this loaded at the bottom right corner of your RouteXL window.
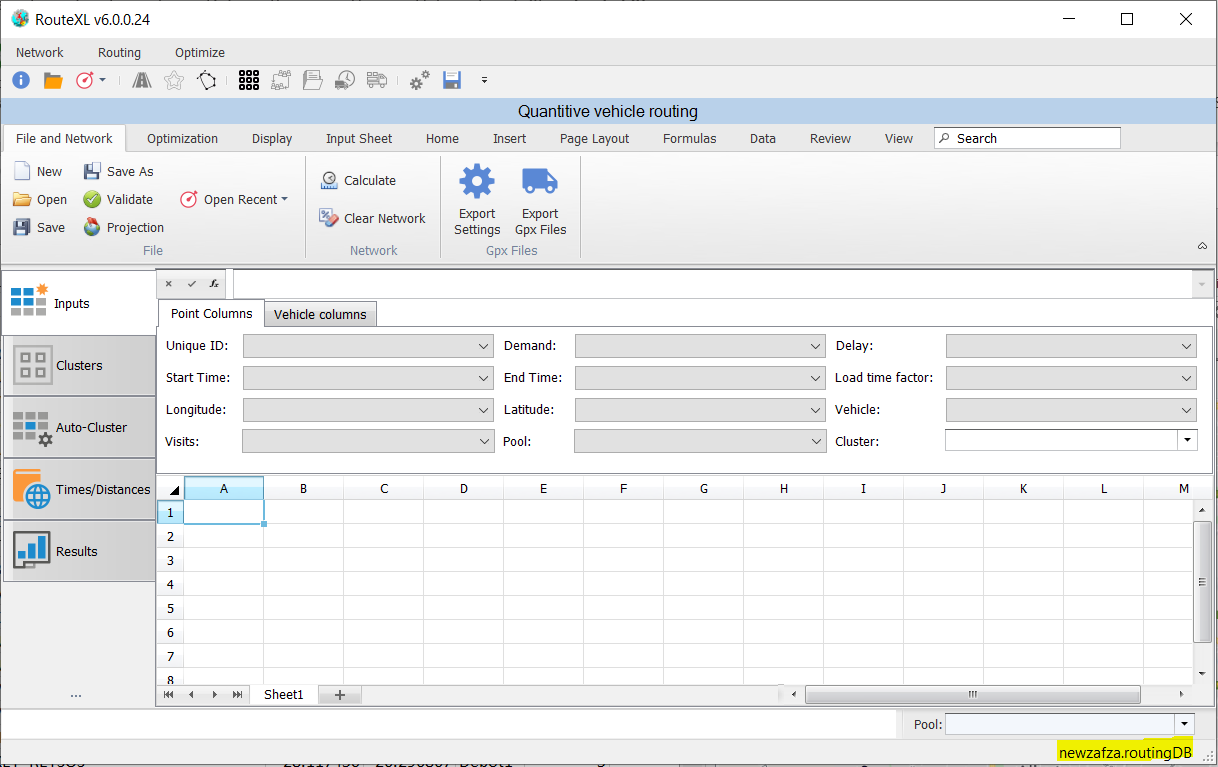
❖At this point you can copy and paste your point data (customer data) from a Microsoft Excel Sheet in the Point Columns sheet in QVR. (You can alternatively just create your sheet straight in QVR with changes if need be. It works just like Microsoft Excel)
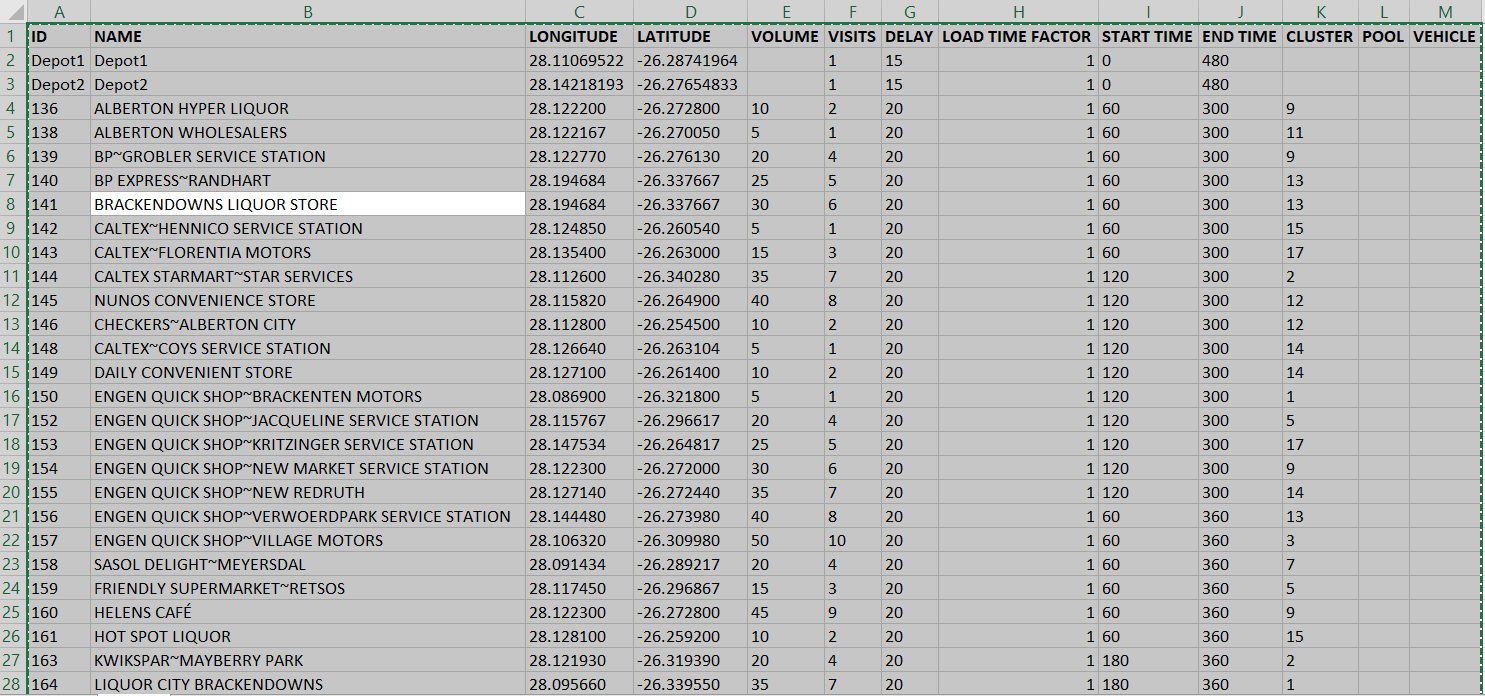
(Ensure you have included your Depot/Warehouse etc in this sheet as well, see example above of Depot1 and Depot2)
❖Before you do anything else you will need to Set Point Range so it is identified in QVR. (You are usually prompted to do this anyway by viewing the red bar at the bottom of the window.)
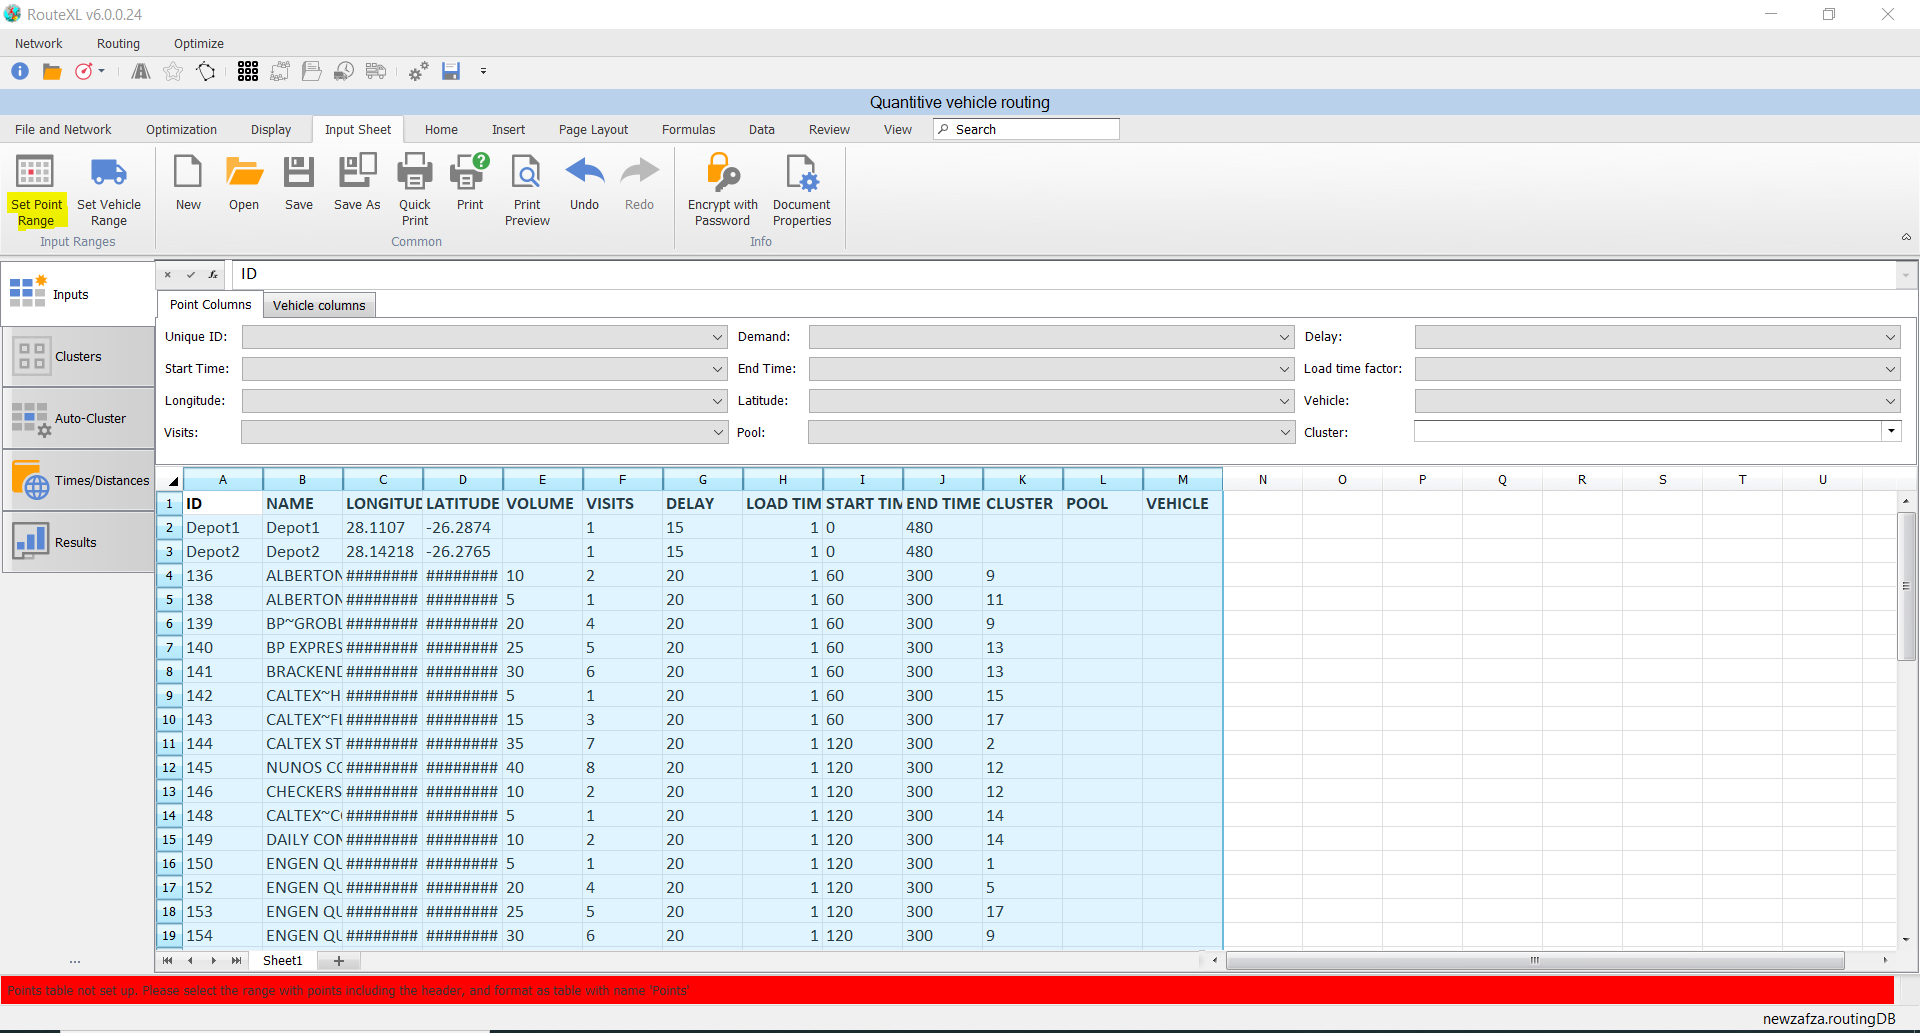
❖Click Set Point Range.
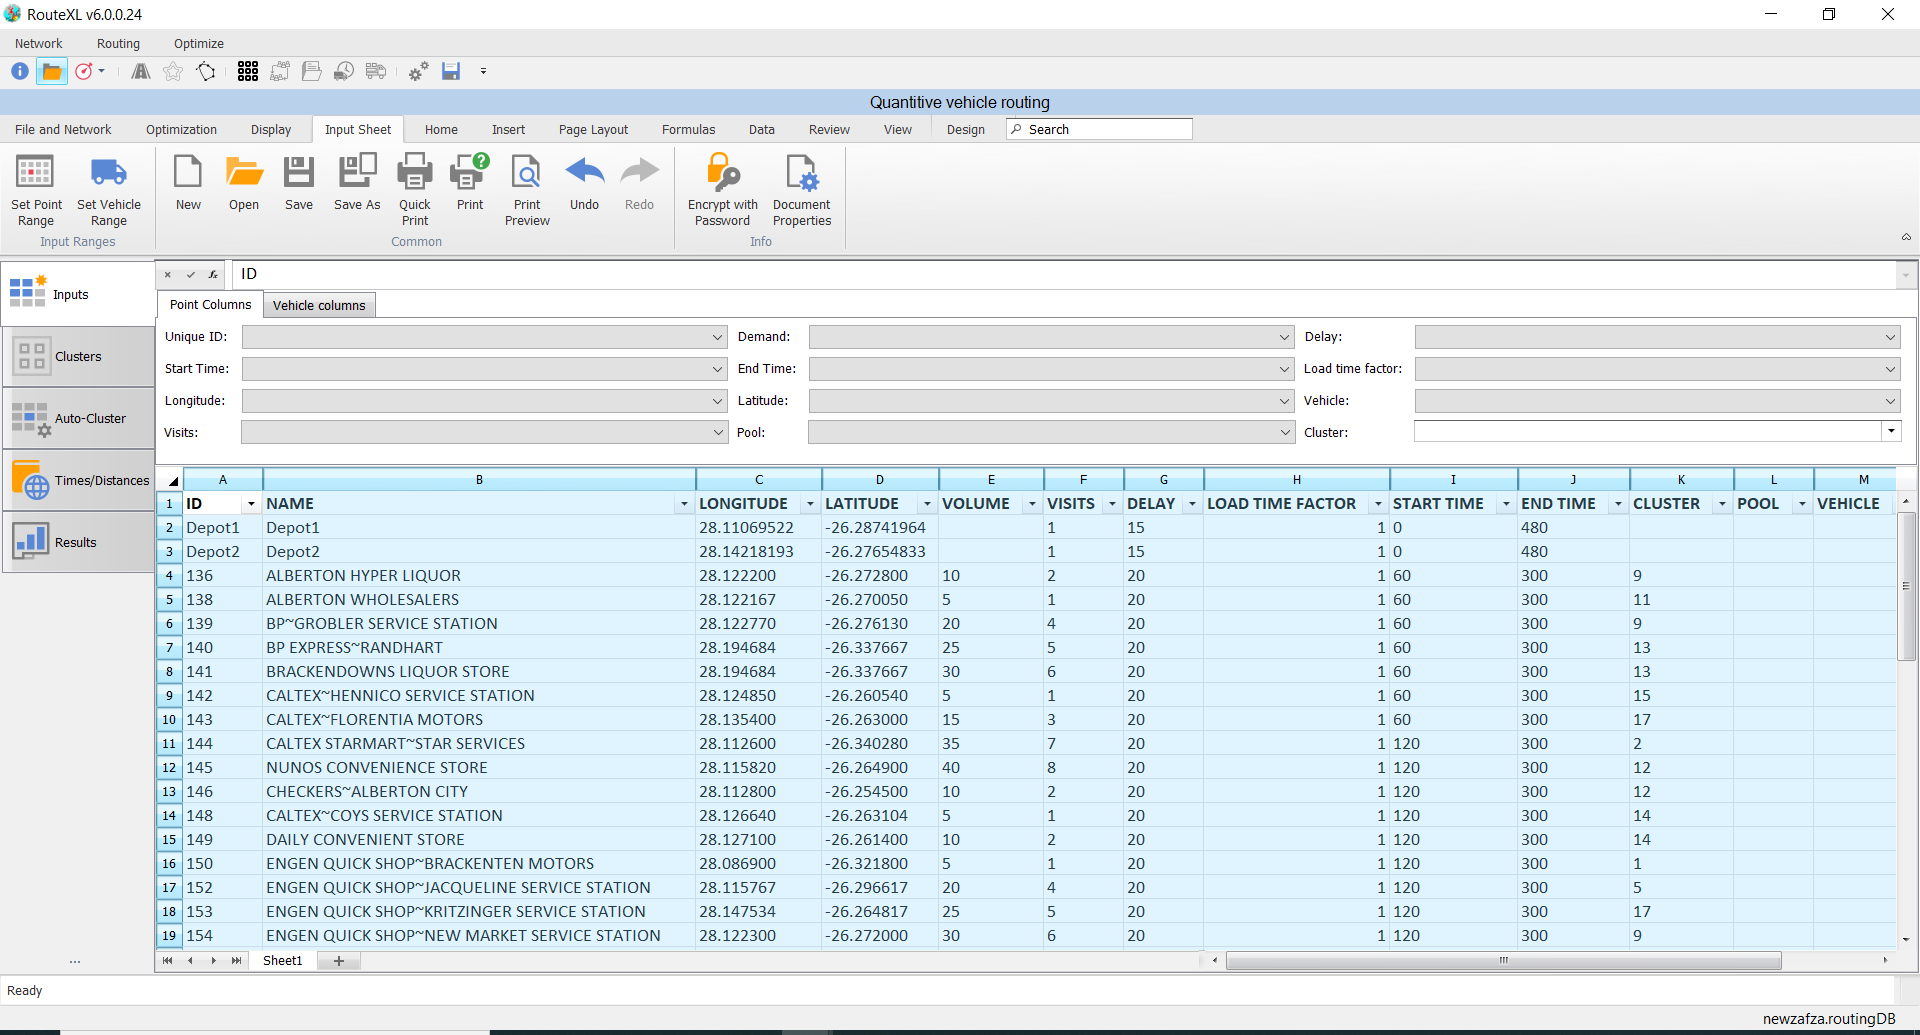
❖Your Point Range is now set per the above screenshot.
❖You can also rename your Sheet1 if need be by double clicking on it. I renamed my Sheet1 as Points to make it clearer for me.

❖Now you will need to set up your Point Columns by clicking and selecting the appropriate field on the various dropdown arrows.
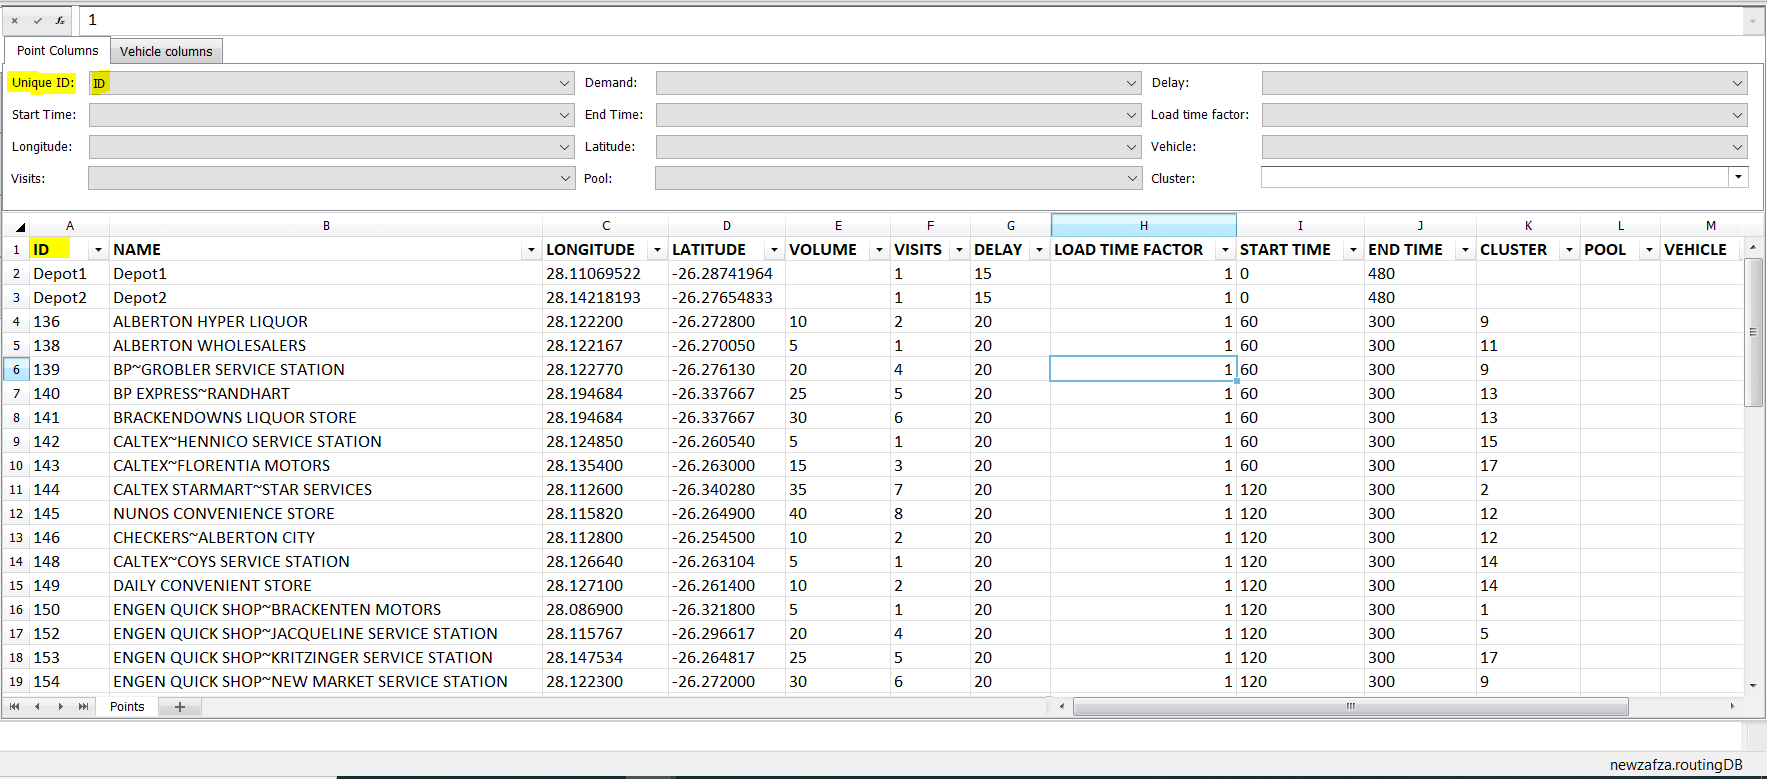
(The data in the ID column must have unique values otherwise you will get an error message. You can just change the cell to a unique value right then and there if that is the case.)
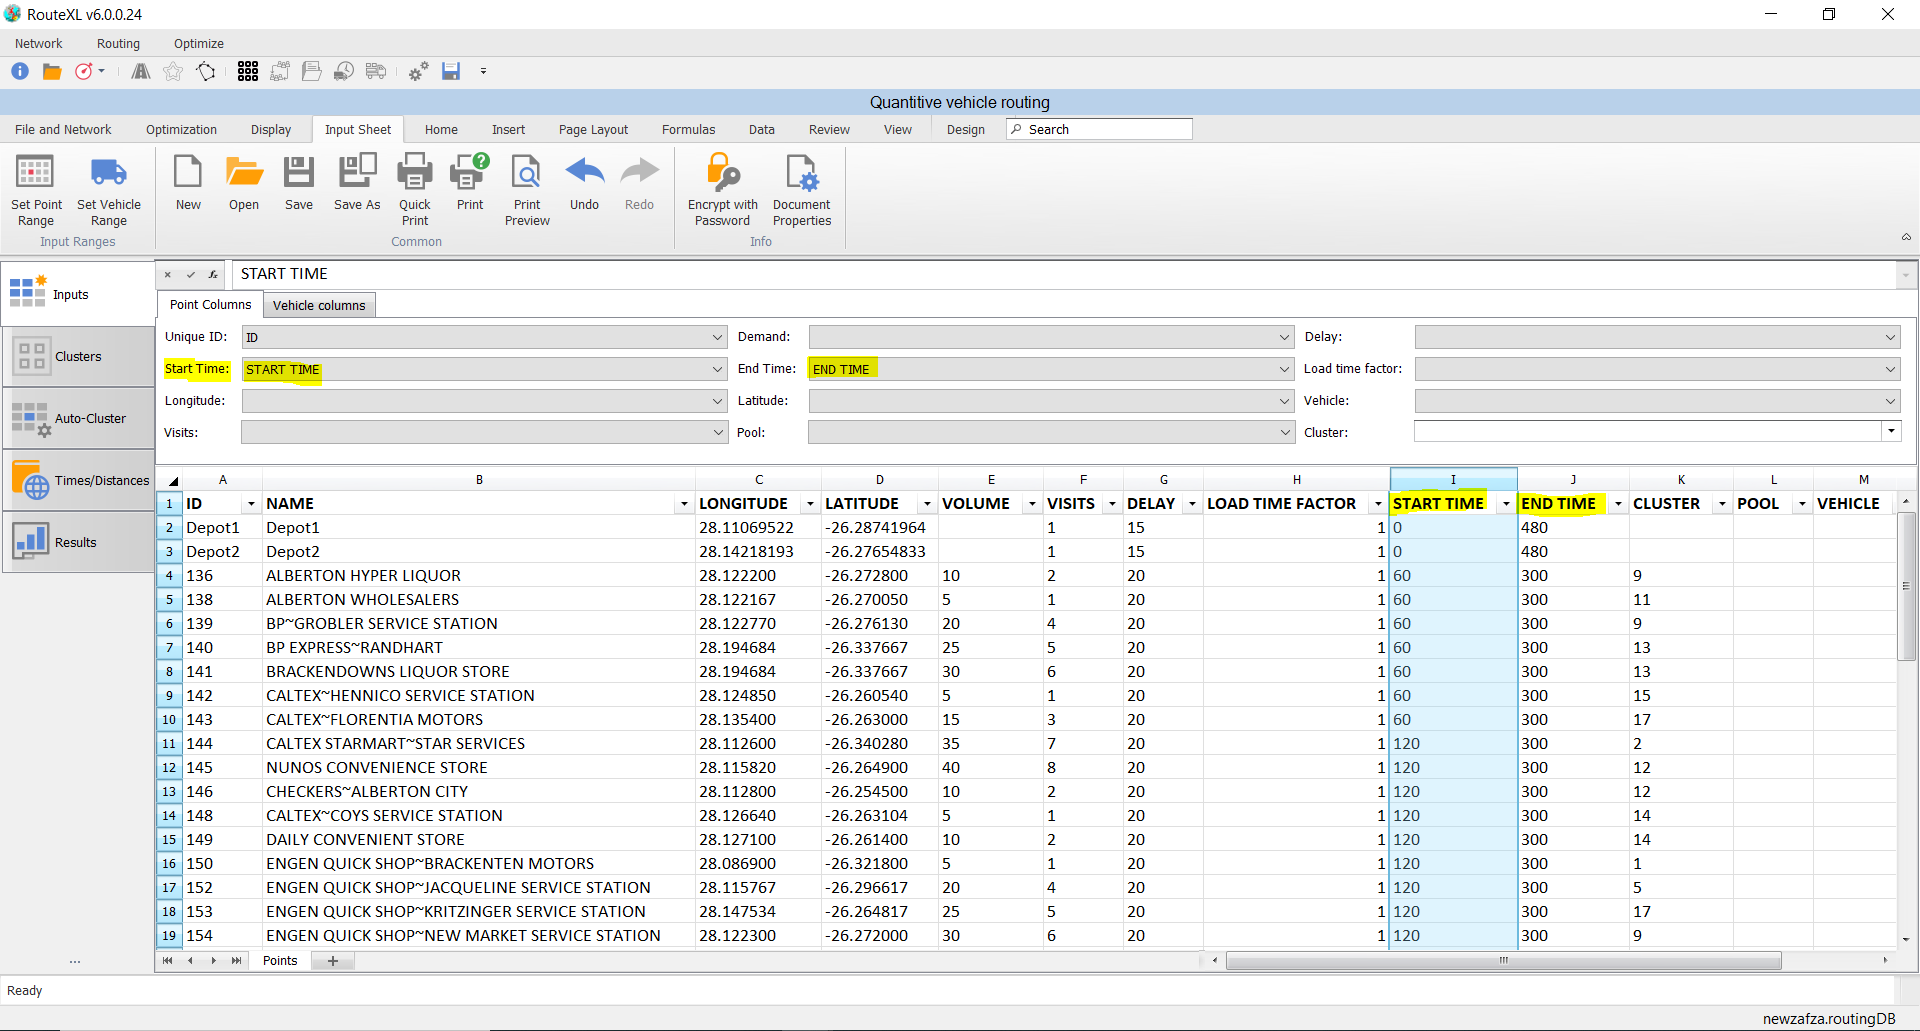
❖If you want to set various operating hours for your depots and customers, you will do this by having START TIME and END TIME columns and selecting these in the dropdown arrows as above.
(The way this works is in minutes. Let’s assume 0 is your START TIME at your depots and 480 is the END TIME. This would mean your depots operate from 8am (You can assume 0 as any START TIME but I assumed it as 8am in this example) until 480 minutes later which is 4pm. This is the END TIME.
The customers in the example above work on the same principle. You will see some customers operate from 60 as the START TIME which is 60 minutes from 0. By assuming 8am is the START TIME, this would mean 60 minutes from it is 9am. And these customers would close at 300 minutes which would mean 1pm. That is the END TIME.)
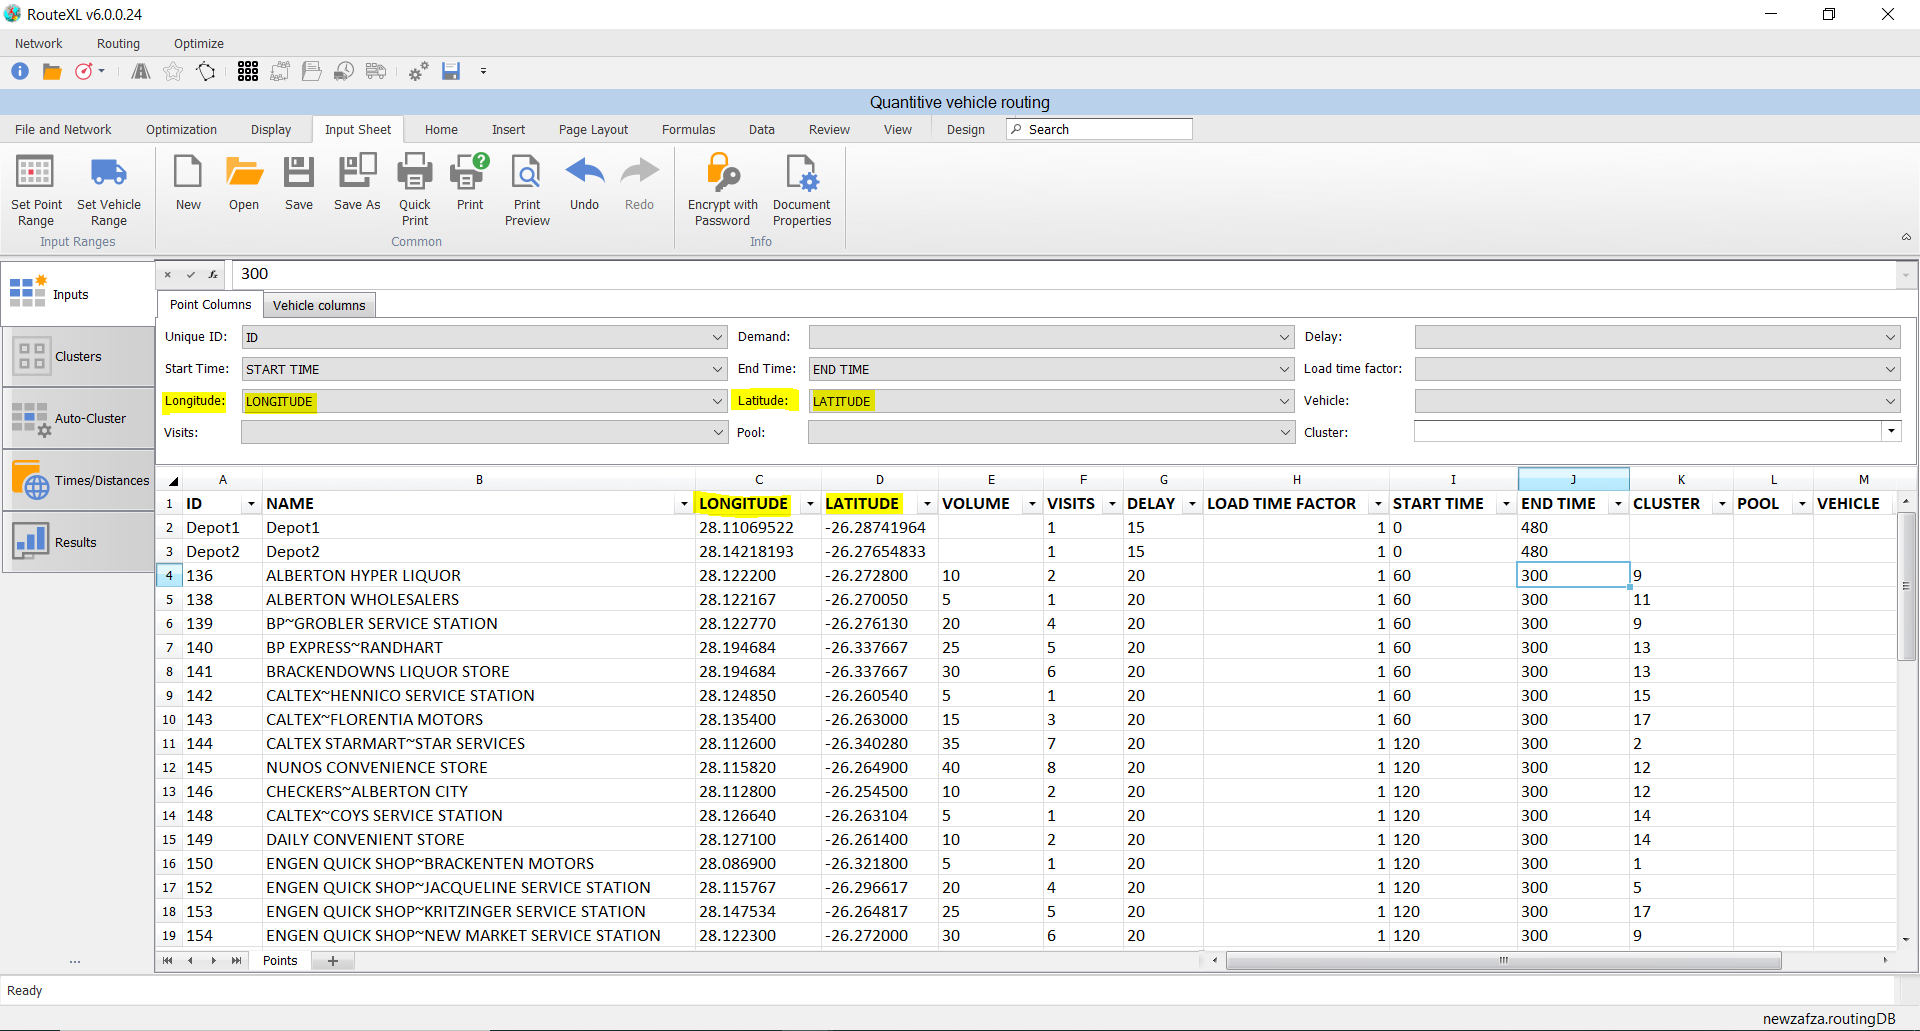
❖Set your LONGITUDE and LATITUDE per above.
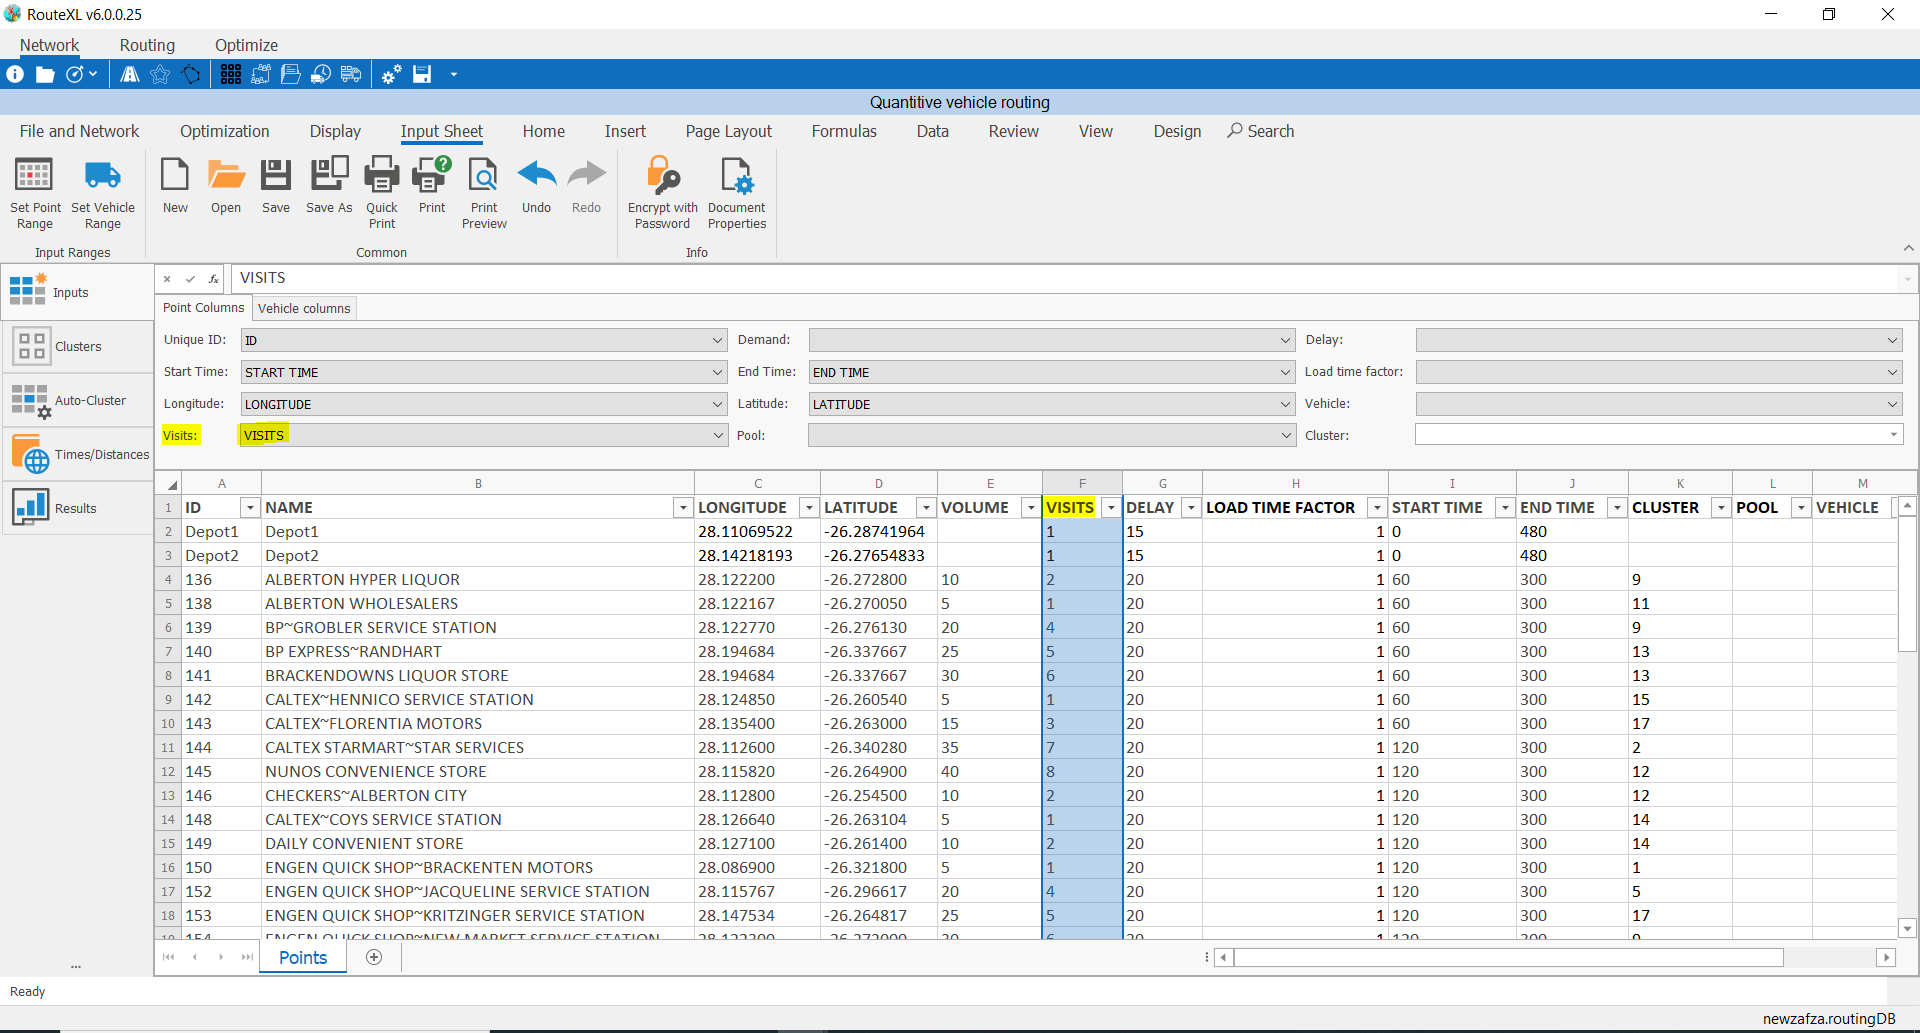
❖If you have a 10-pallet truck for example and need to deliver 30 pallets to a customer, you wouldn’t be able to do this in one visit. You would do this in 3 visits. That’s where you can use a VISITS column and assign number of visits per screenshot above. (Note: As a default you always need to put a 1 by the Depots in your VISITS otherwise you won’t get a solution.)
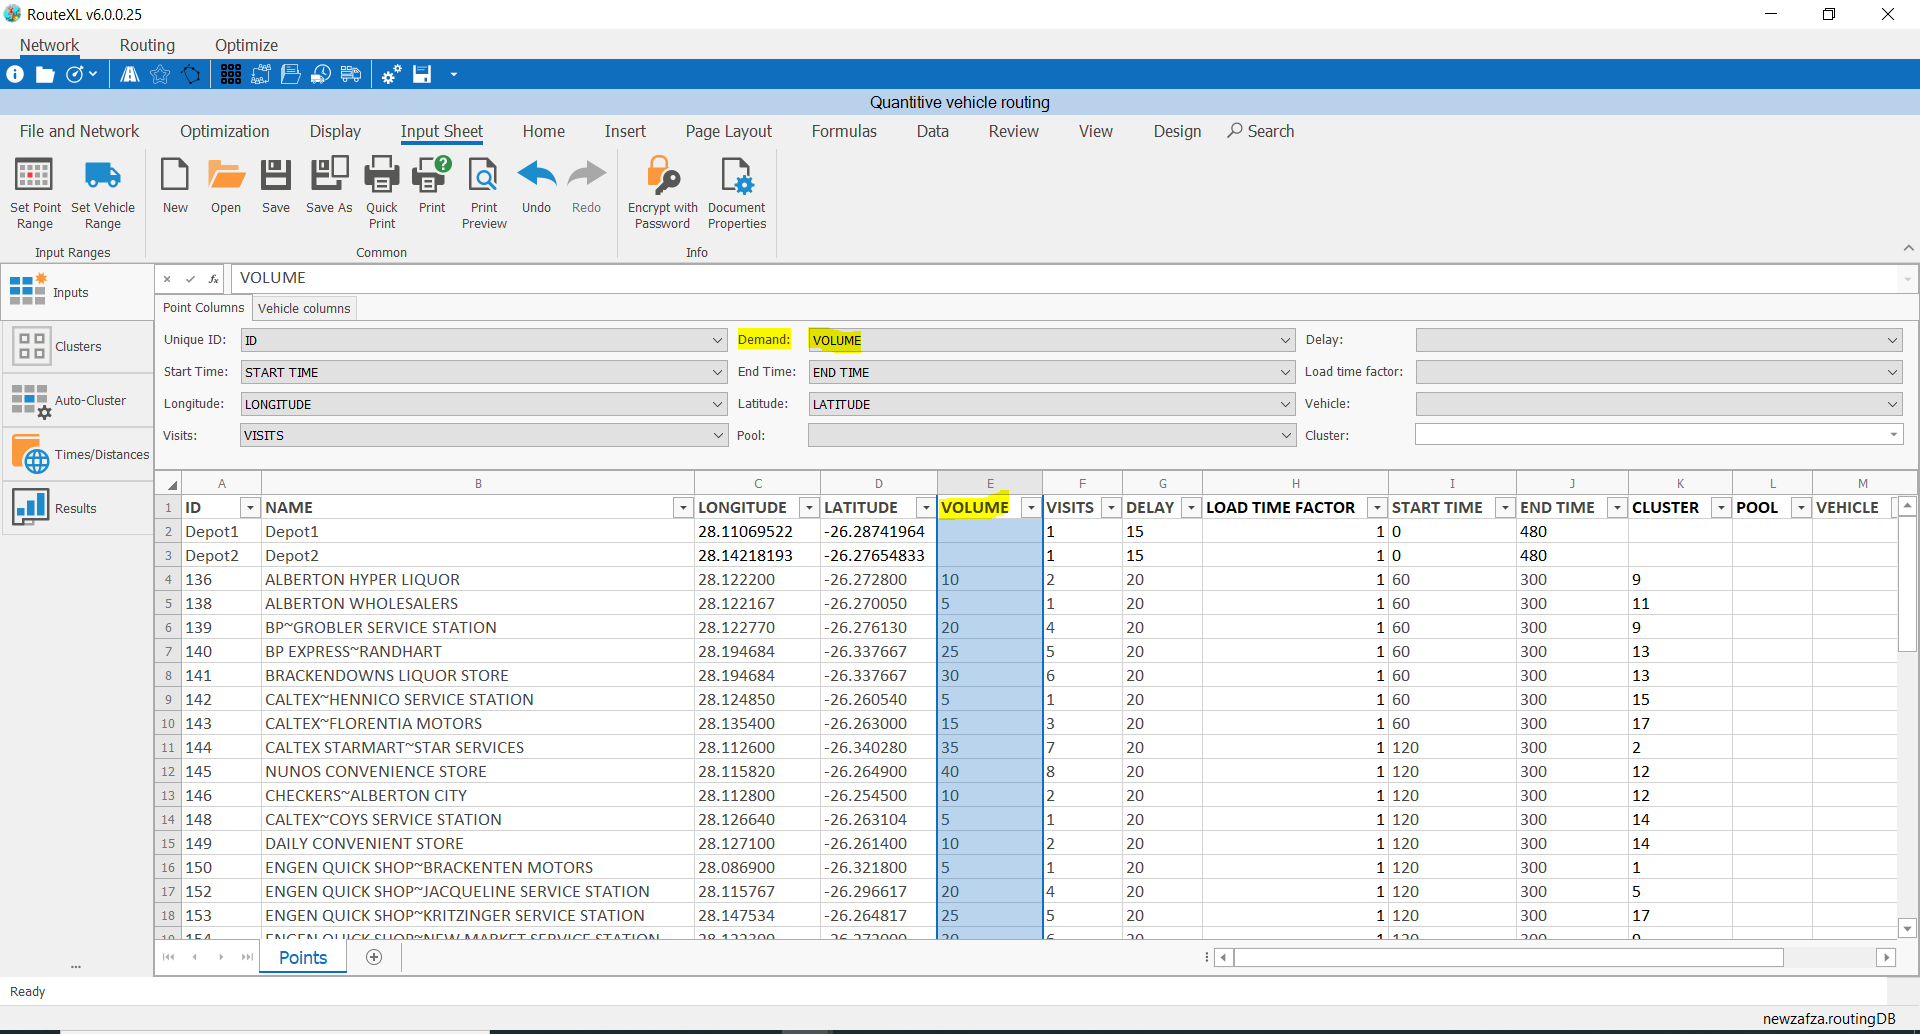
❖Set up your VOLUME column as above.
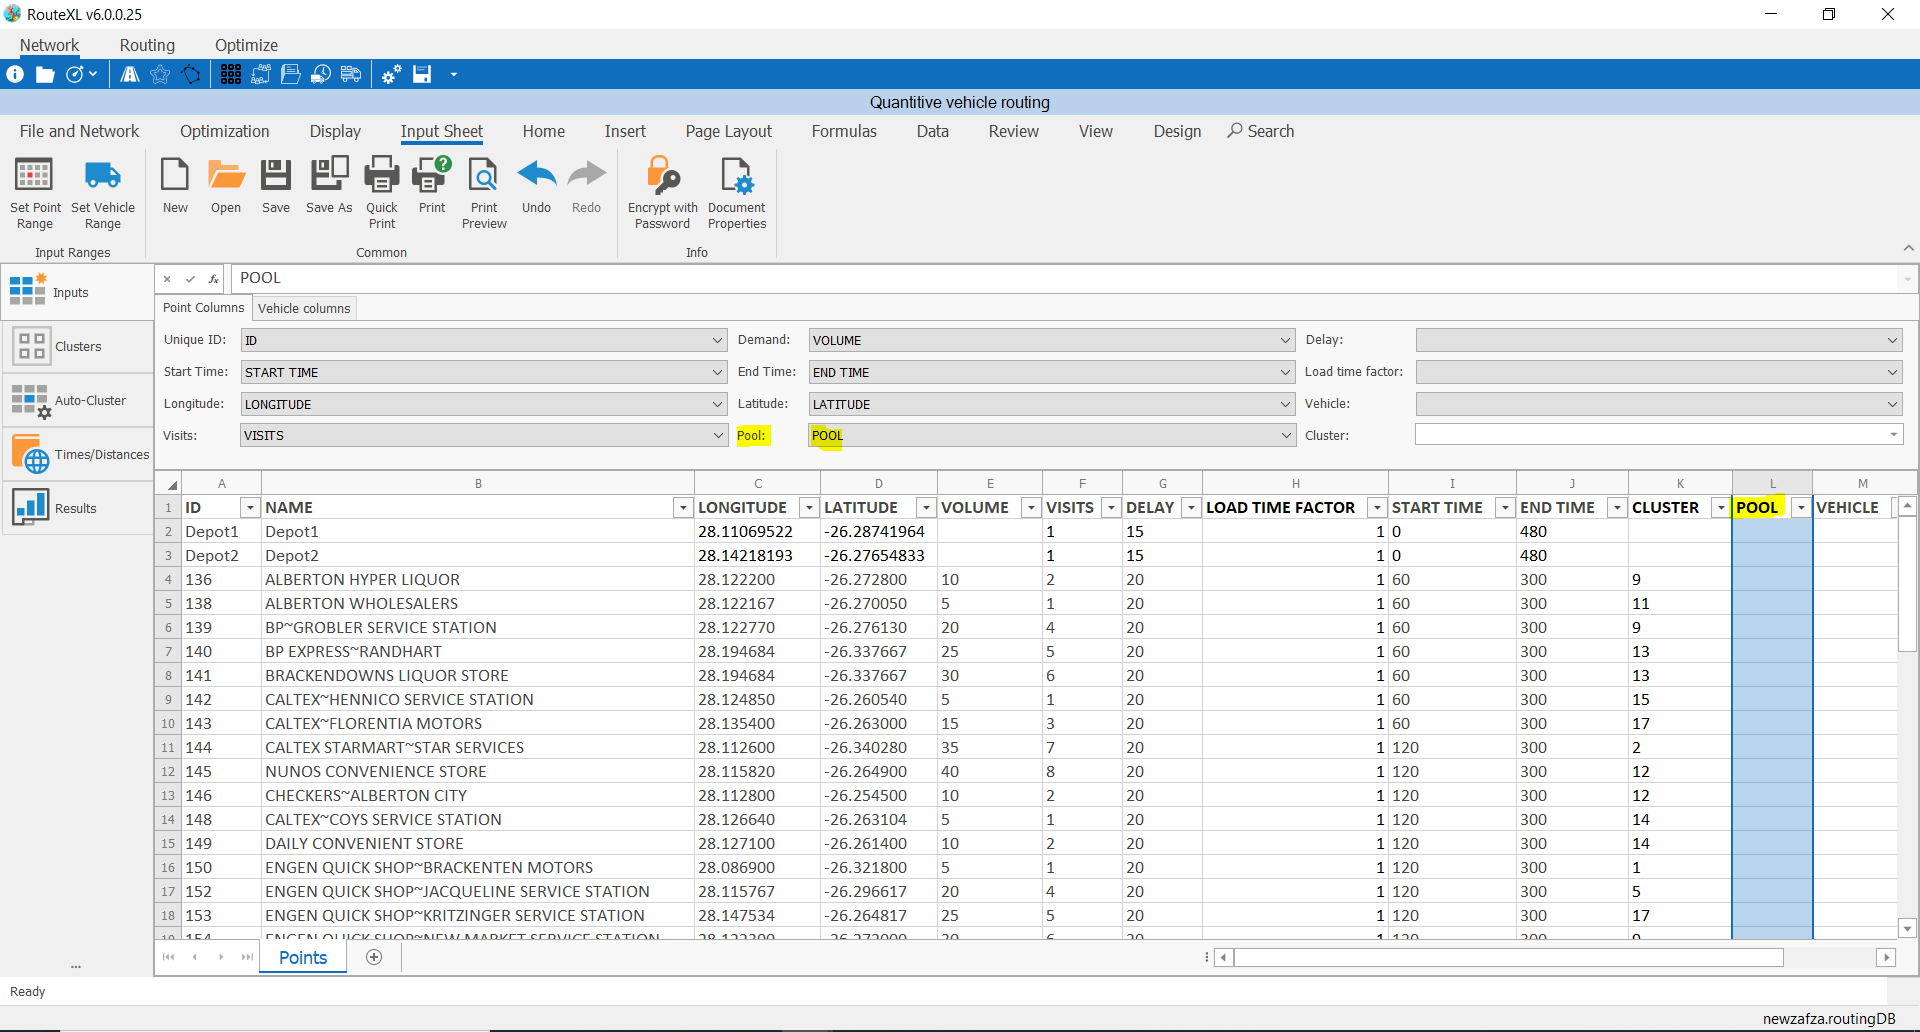
❖Vehicle pools are set up in your Vehicle columns tab which will be described later. You can also set up a blank POOL column as above and when you get your results after a solution is run, the various pool/s will be populated here in your Points sheet.
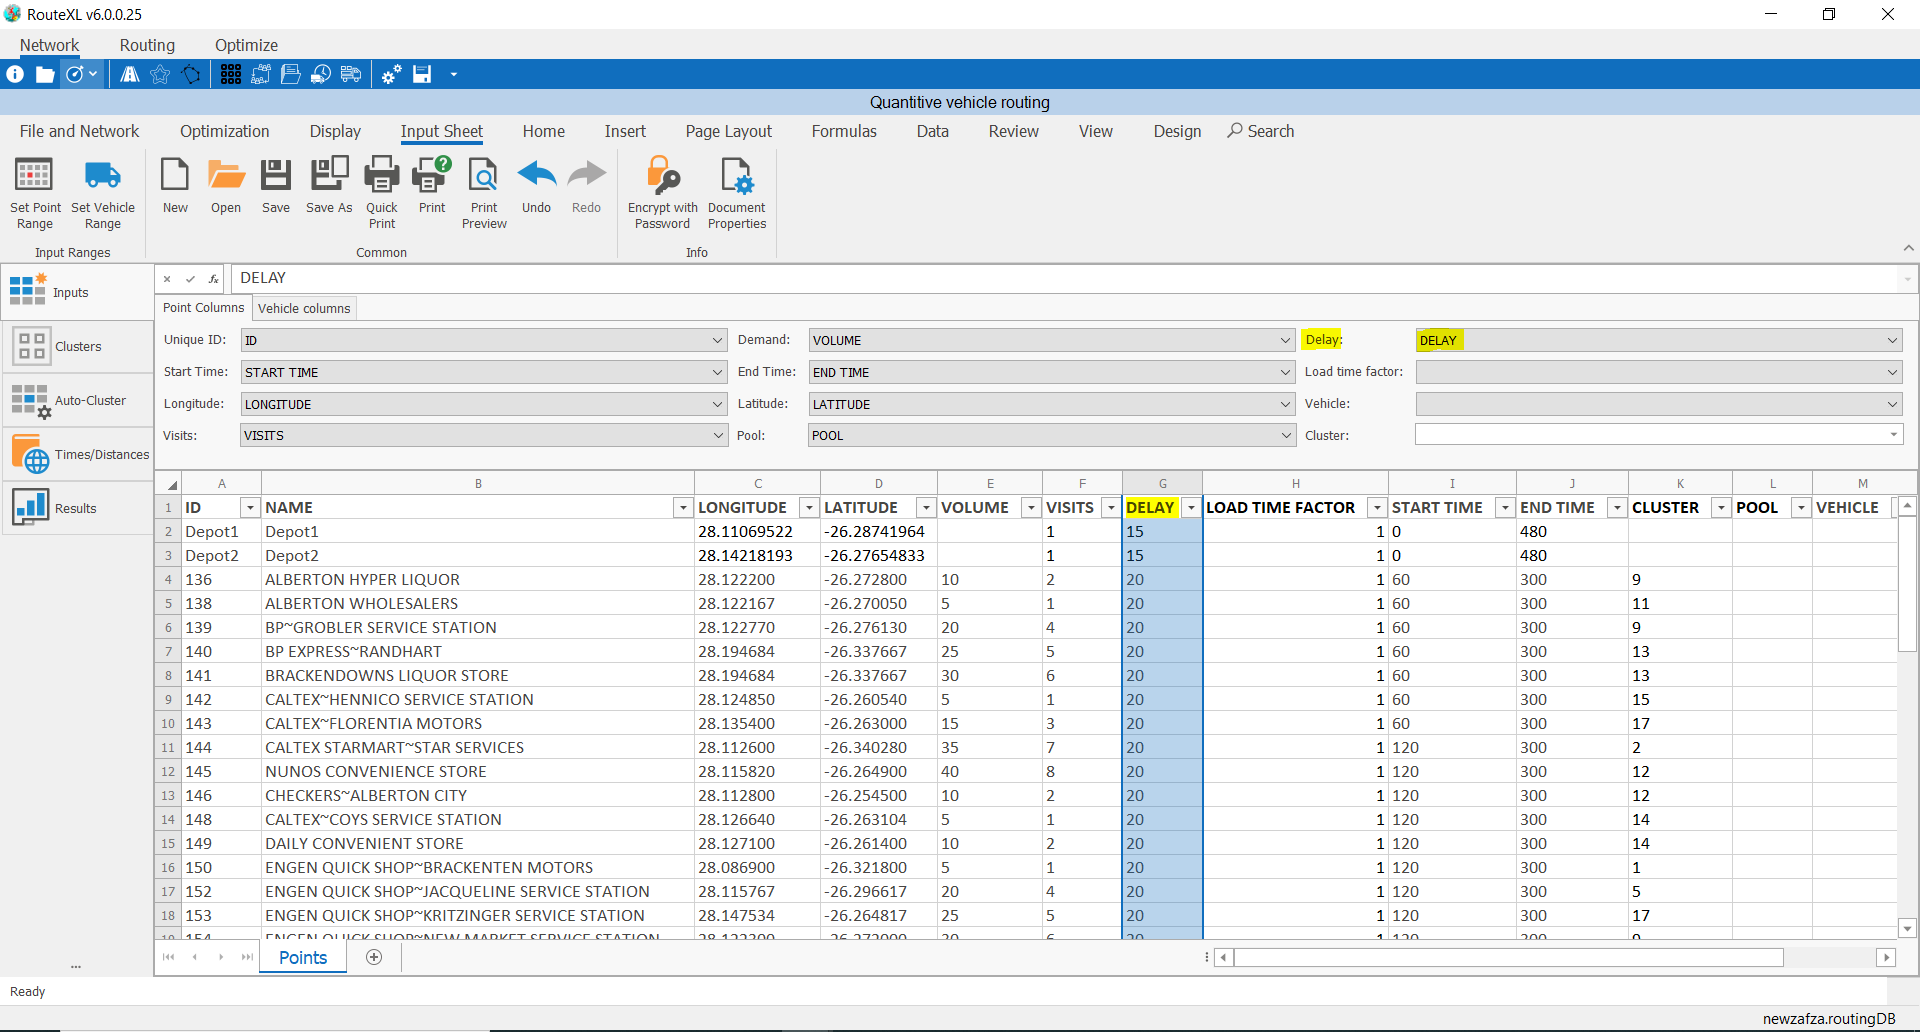
❖If there are any delays at your Depot/s and Customers because of loading/offloading etc you would set up your sheet as above. You can have various cells in this column blank if there aren’t any delays at certain Customers or Depots.
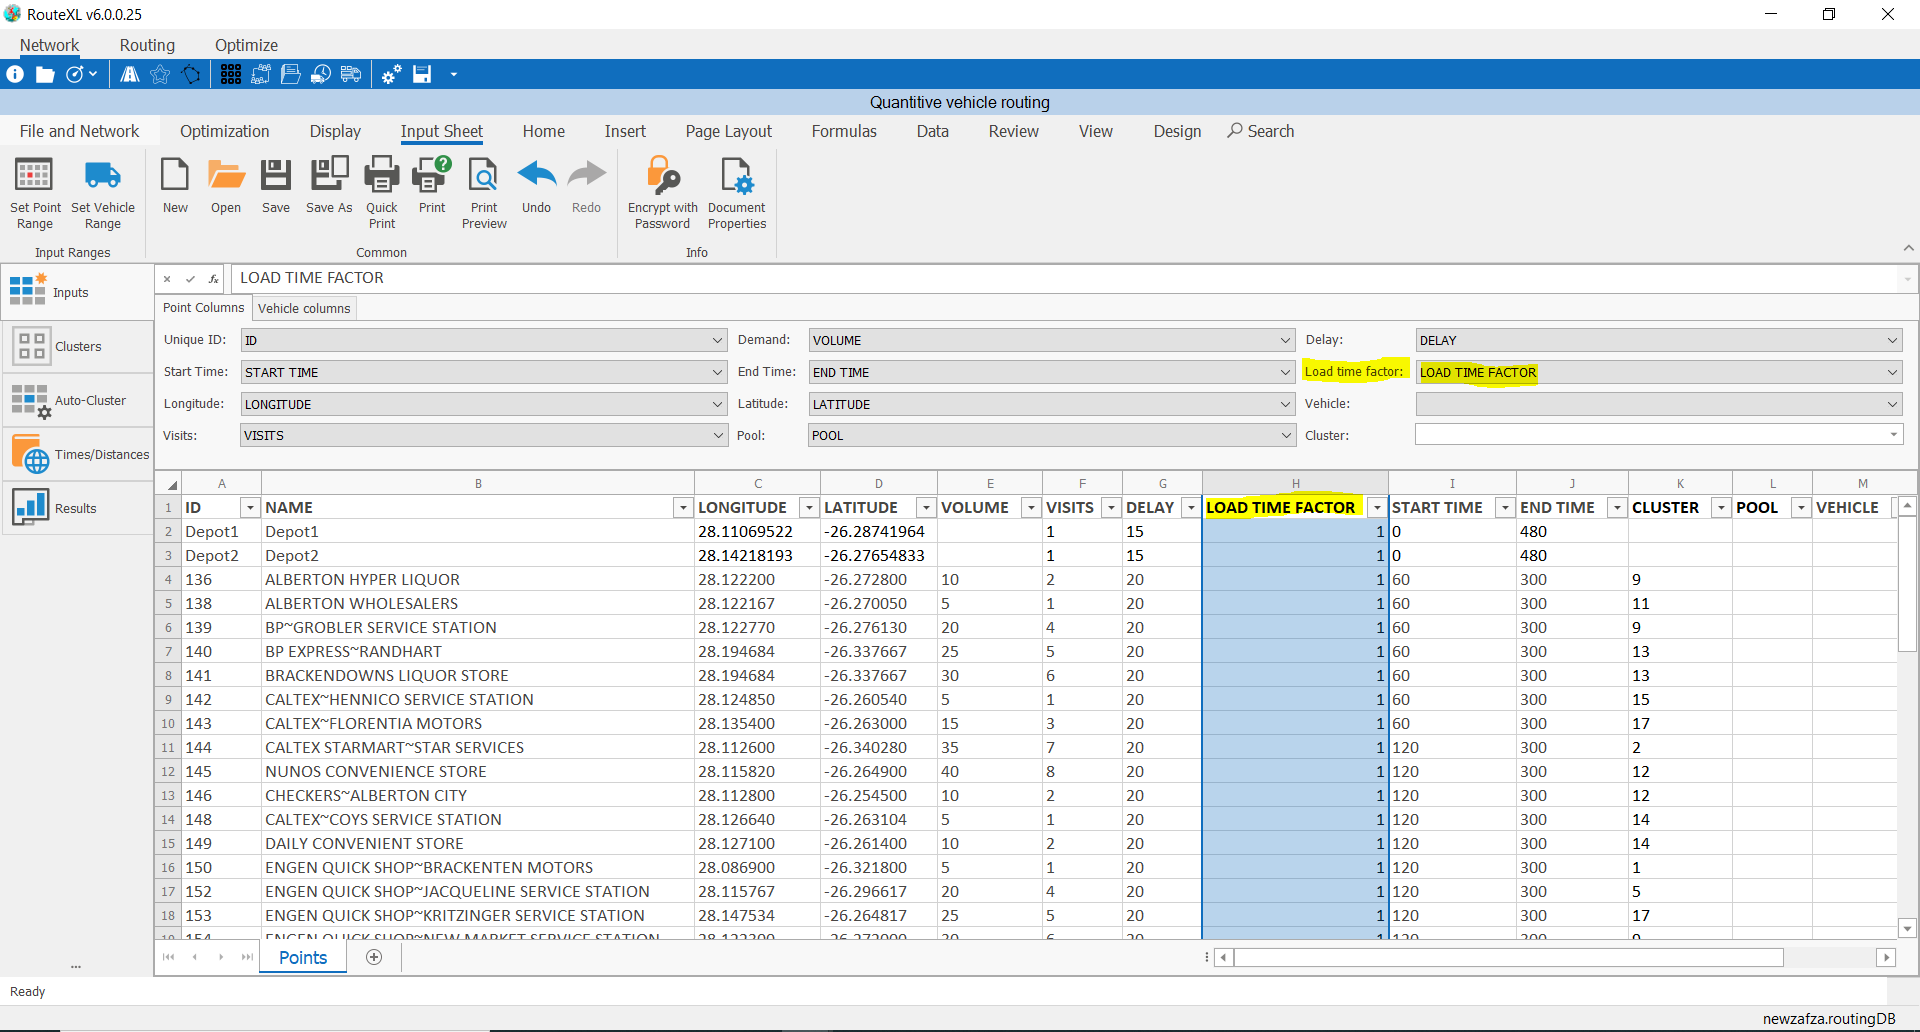
❖LOAD TIME FACTOR column can be used if there is a factor that needs to be changed for various customers/depots because of heavier loads etc. In the screenshot above I have set it at 1 which means no change. I can make the factor 2 which will double the load time.
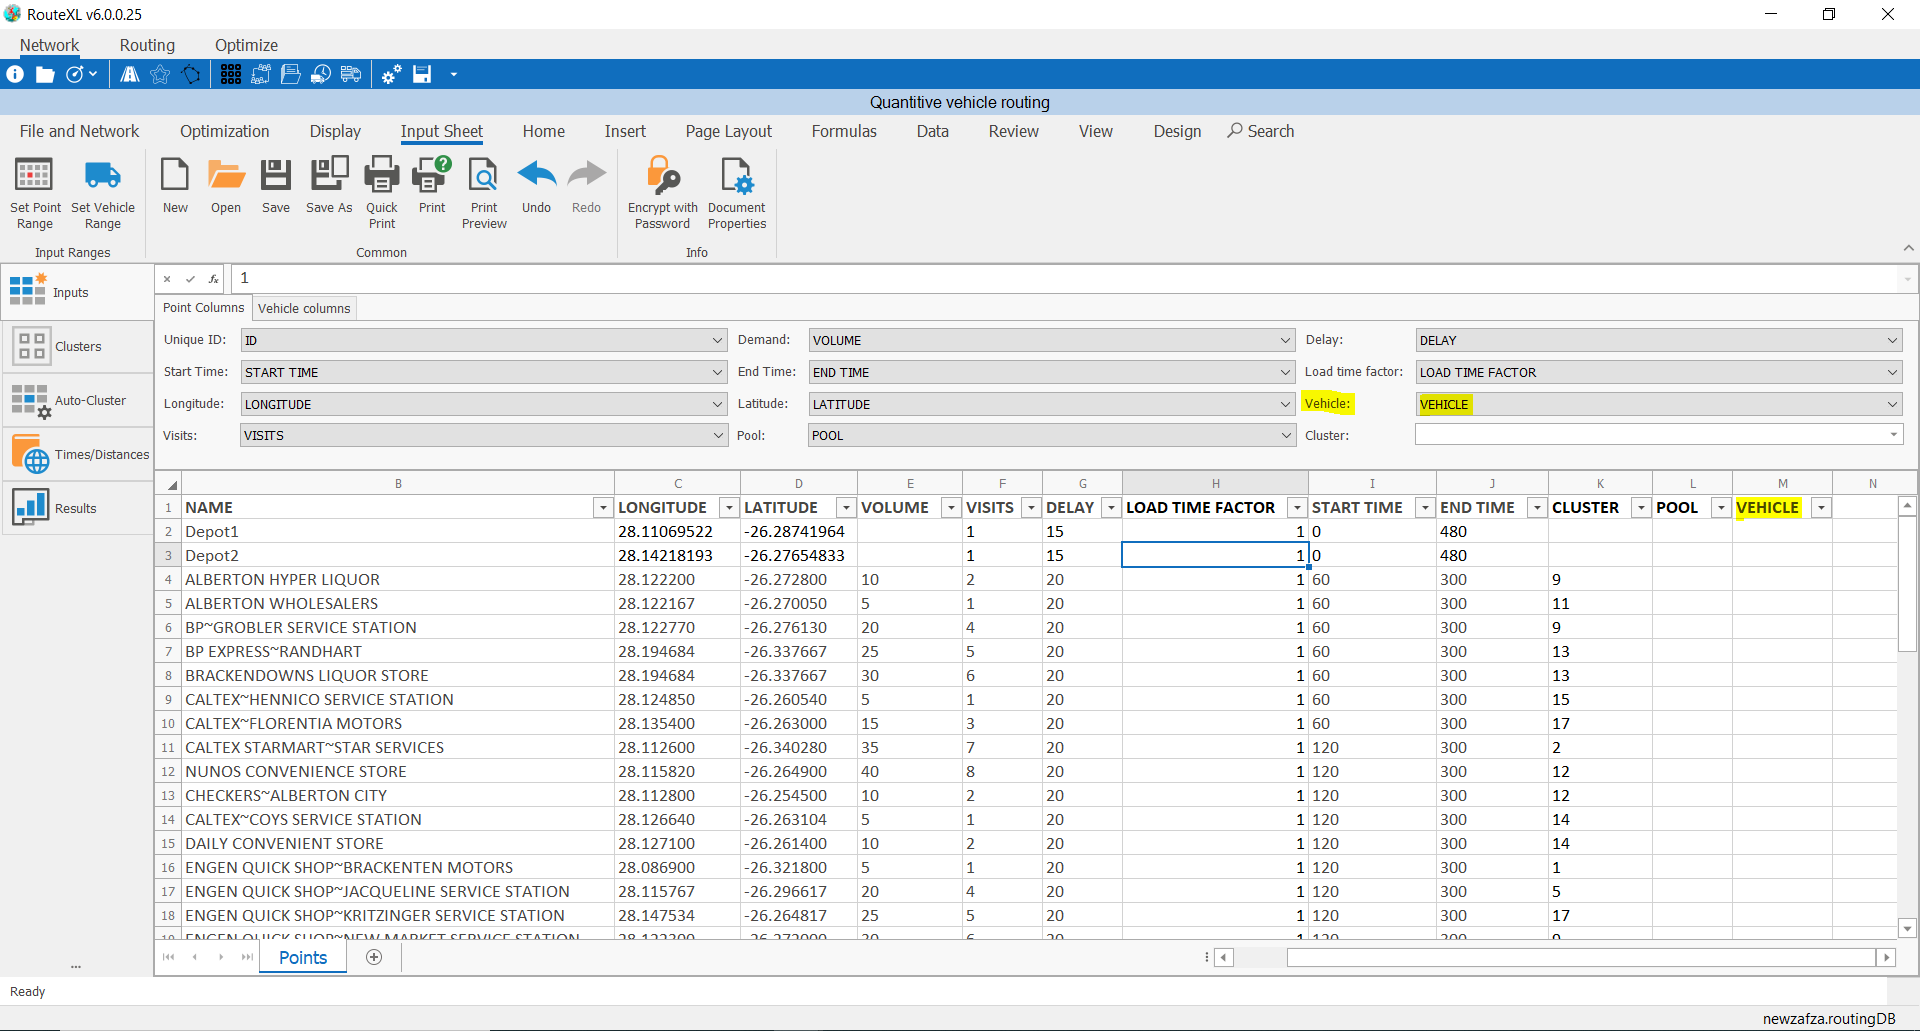
❖Set up this blank column VEHICLE which will be populated with the vehicle used for each point after you run a solution and get results.
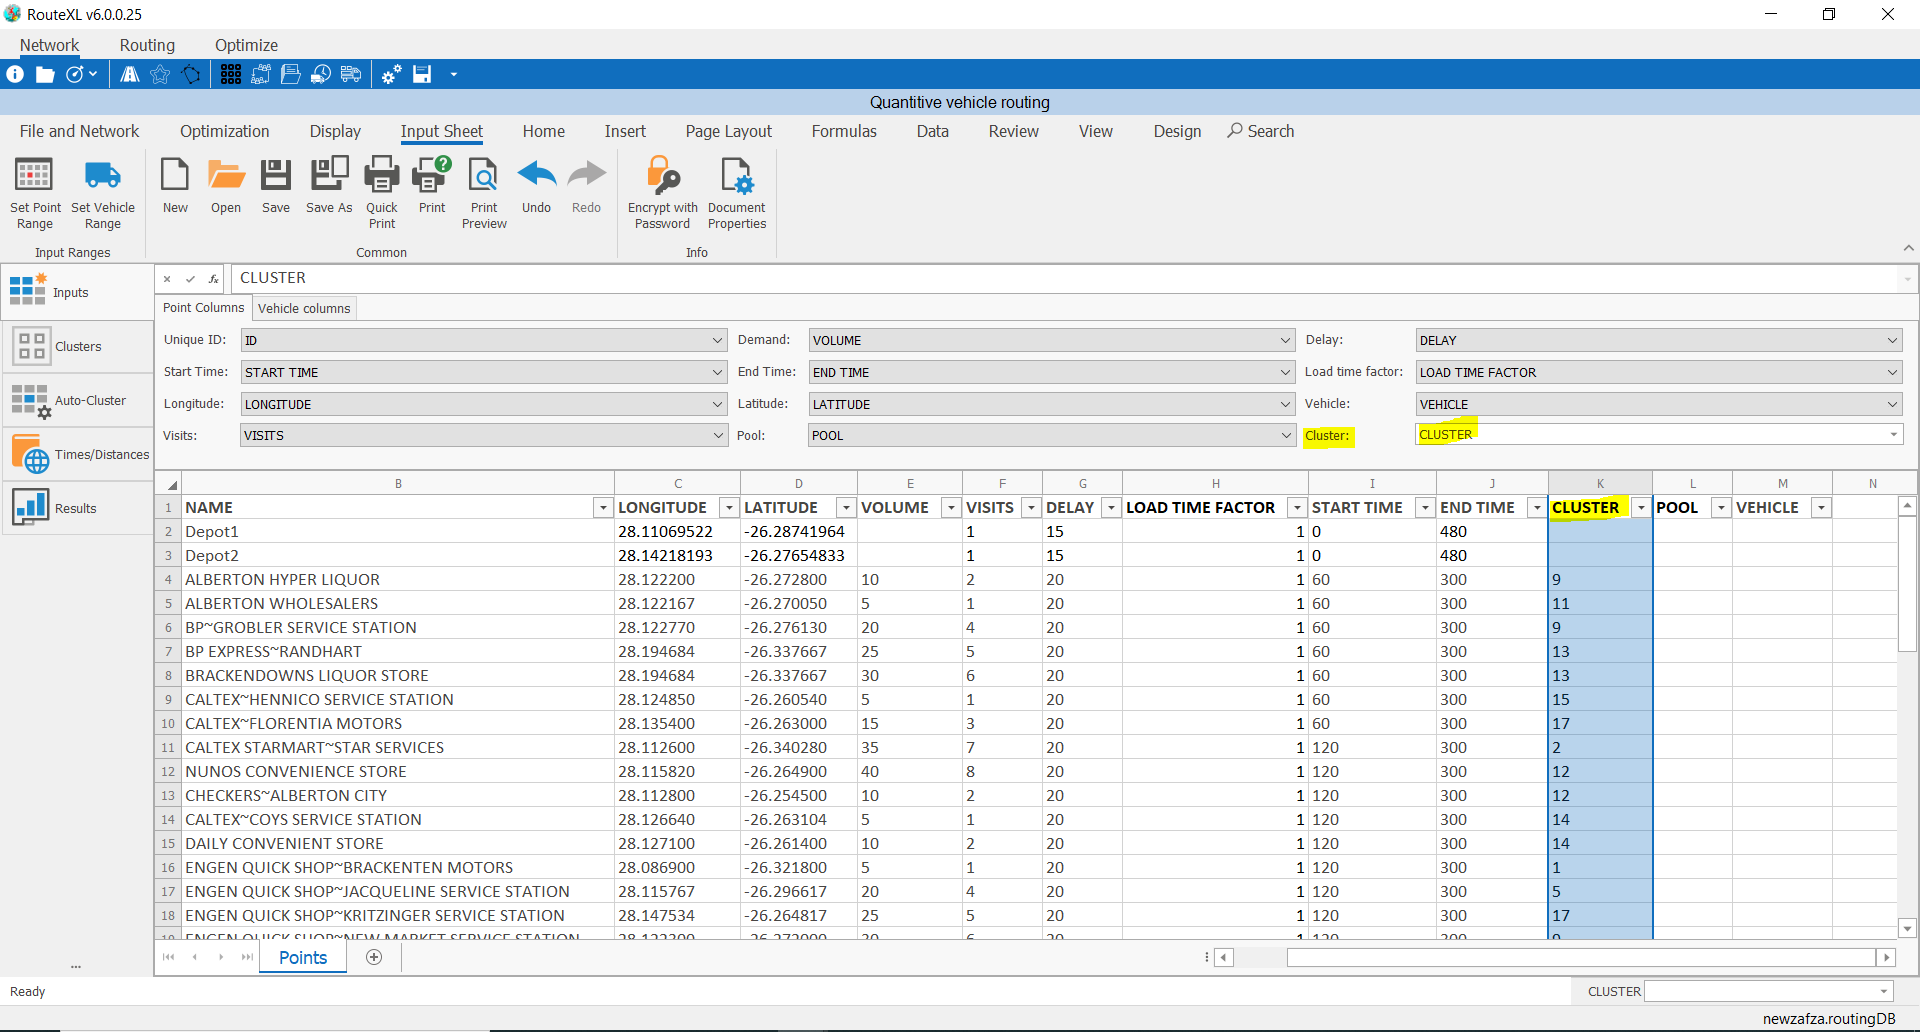
❖For an optimal solution you might want to cluster(group) your points so they can be visited by specific vehicle pools only. (Your vehicle pool can have one or more vehicles in it.)
In this case, you can cluster your points how you want to as I have above and set it up. (I used a SpatialXL tool to help me cluster my points before I copied and pasted my sheet in QVR)
❖NOTE: You don’t need to use or have all columns as I have set up above. It is just a demonstration of using each field. If you don’t need to use a field for example VISITS, you just set it up as <None>.

❖Your Point Columns have been fully set up.
❖Now we’ll set up your Vehicle columns. I added a separate sheet called Vehicles to separate everything out. (You can have your Points and Vehicles on one sheet if you want. You just need to ensure you set your Point Range and Vehicle Range separately.)
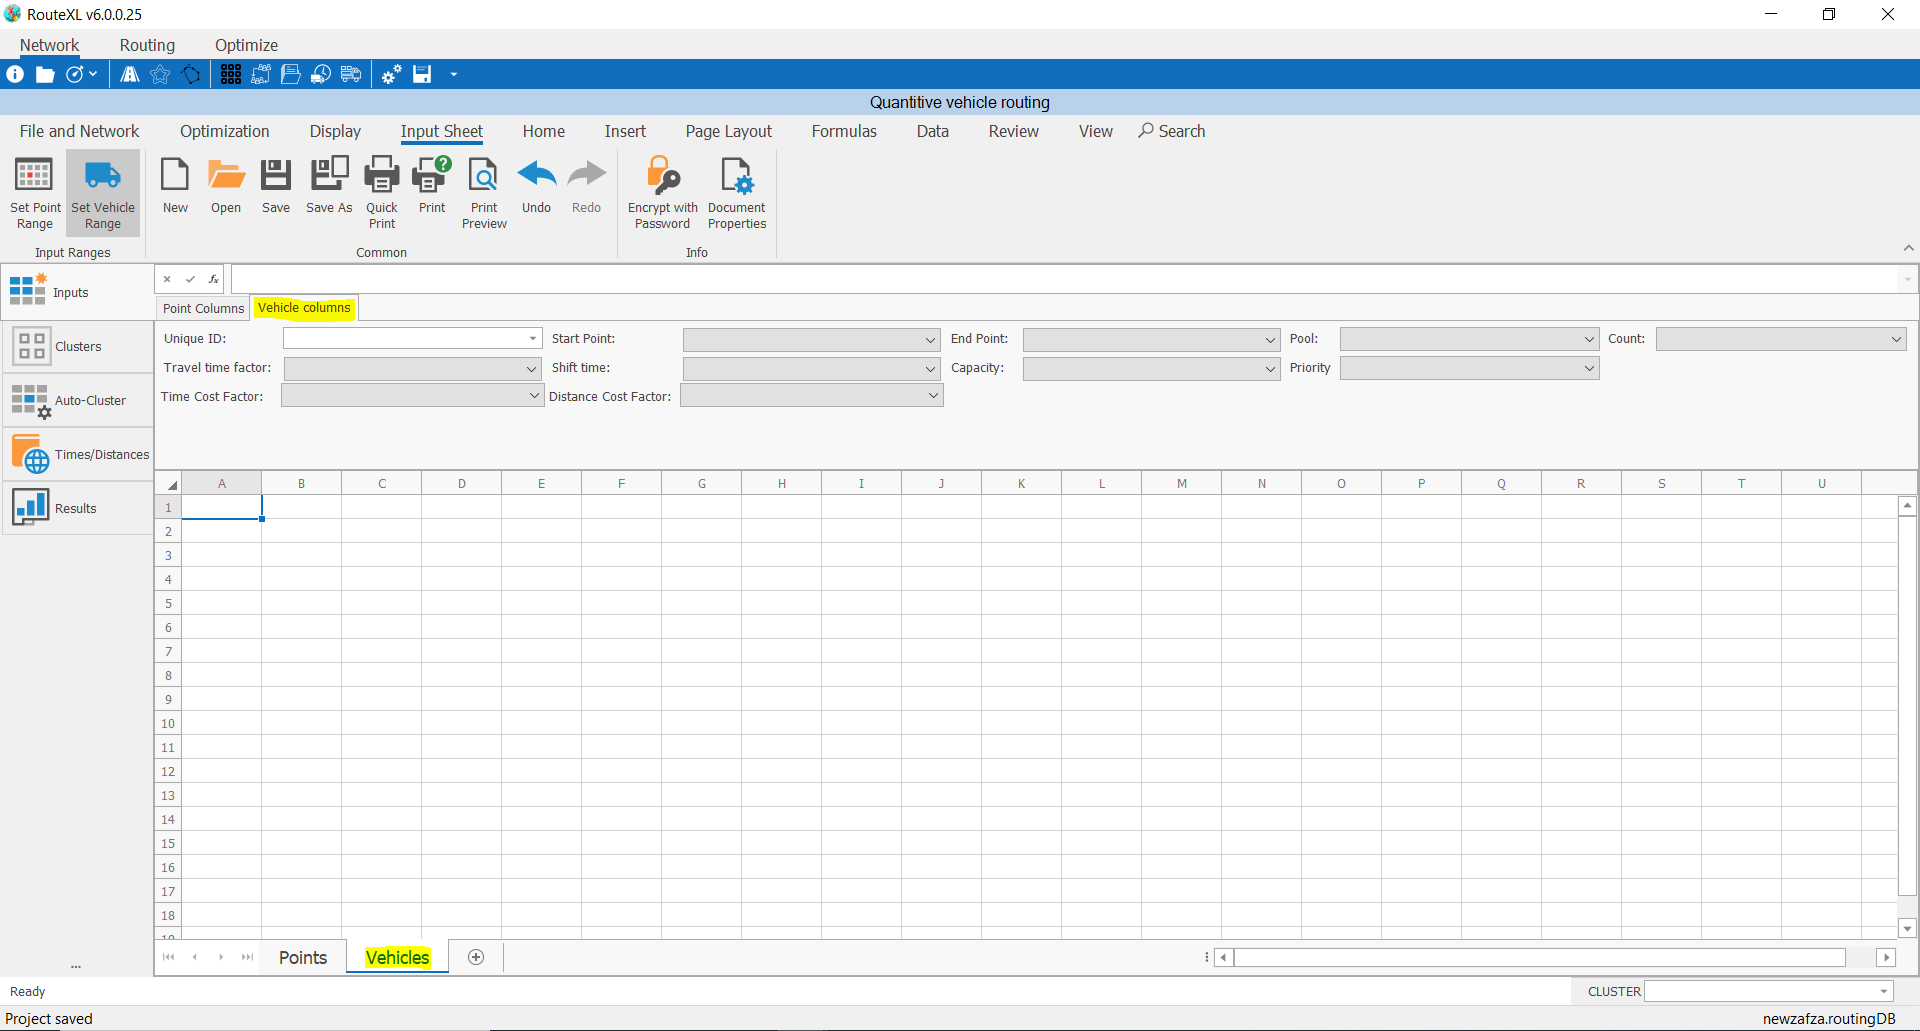
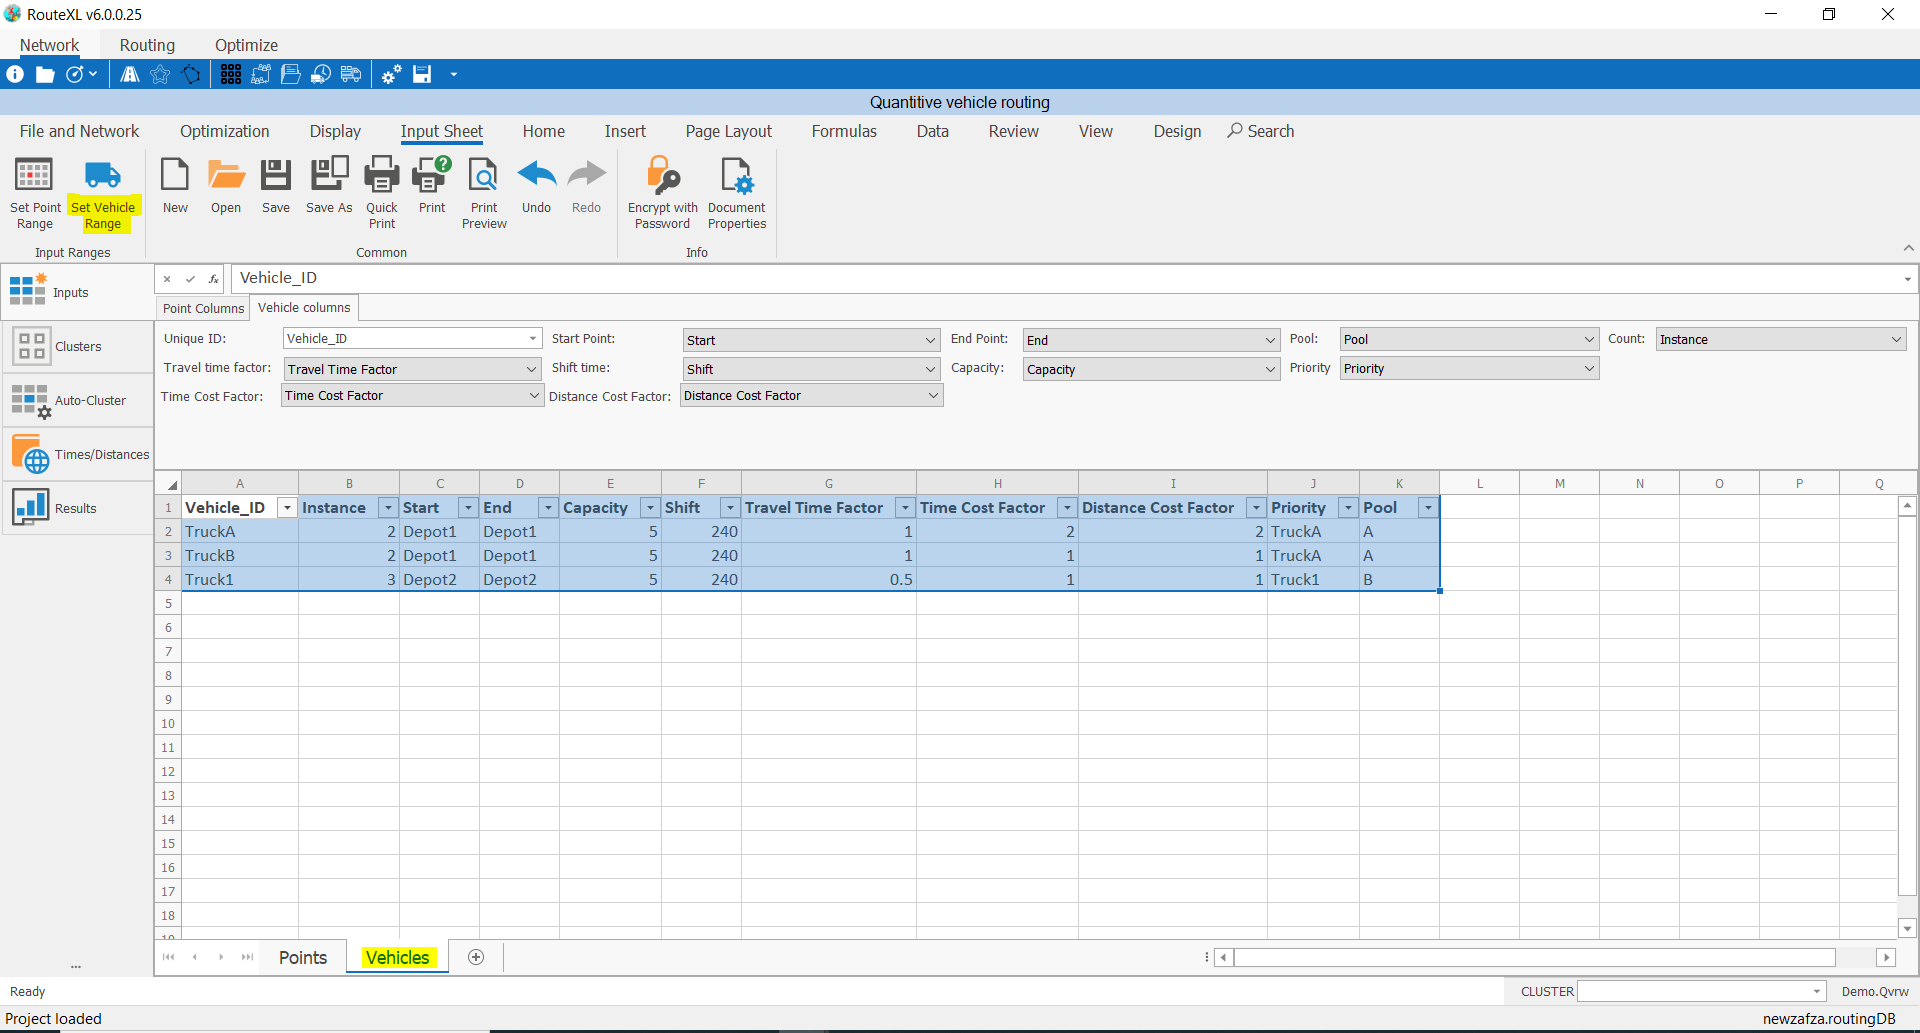
❖I have set up my vehicles here having specific fields which I’ll be explaining. (Remember to Set Vehicle Range after inputting your data!)
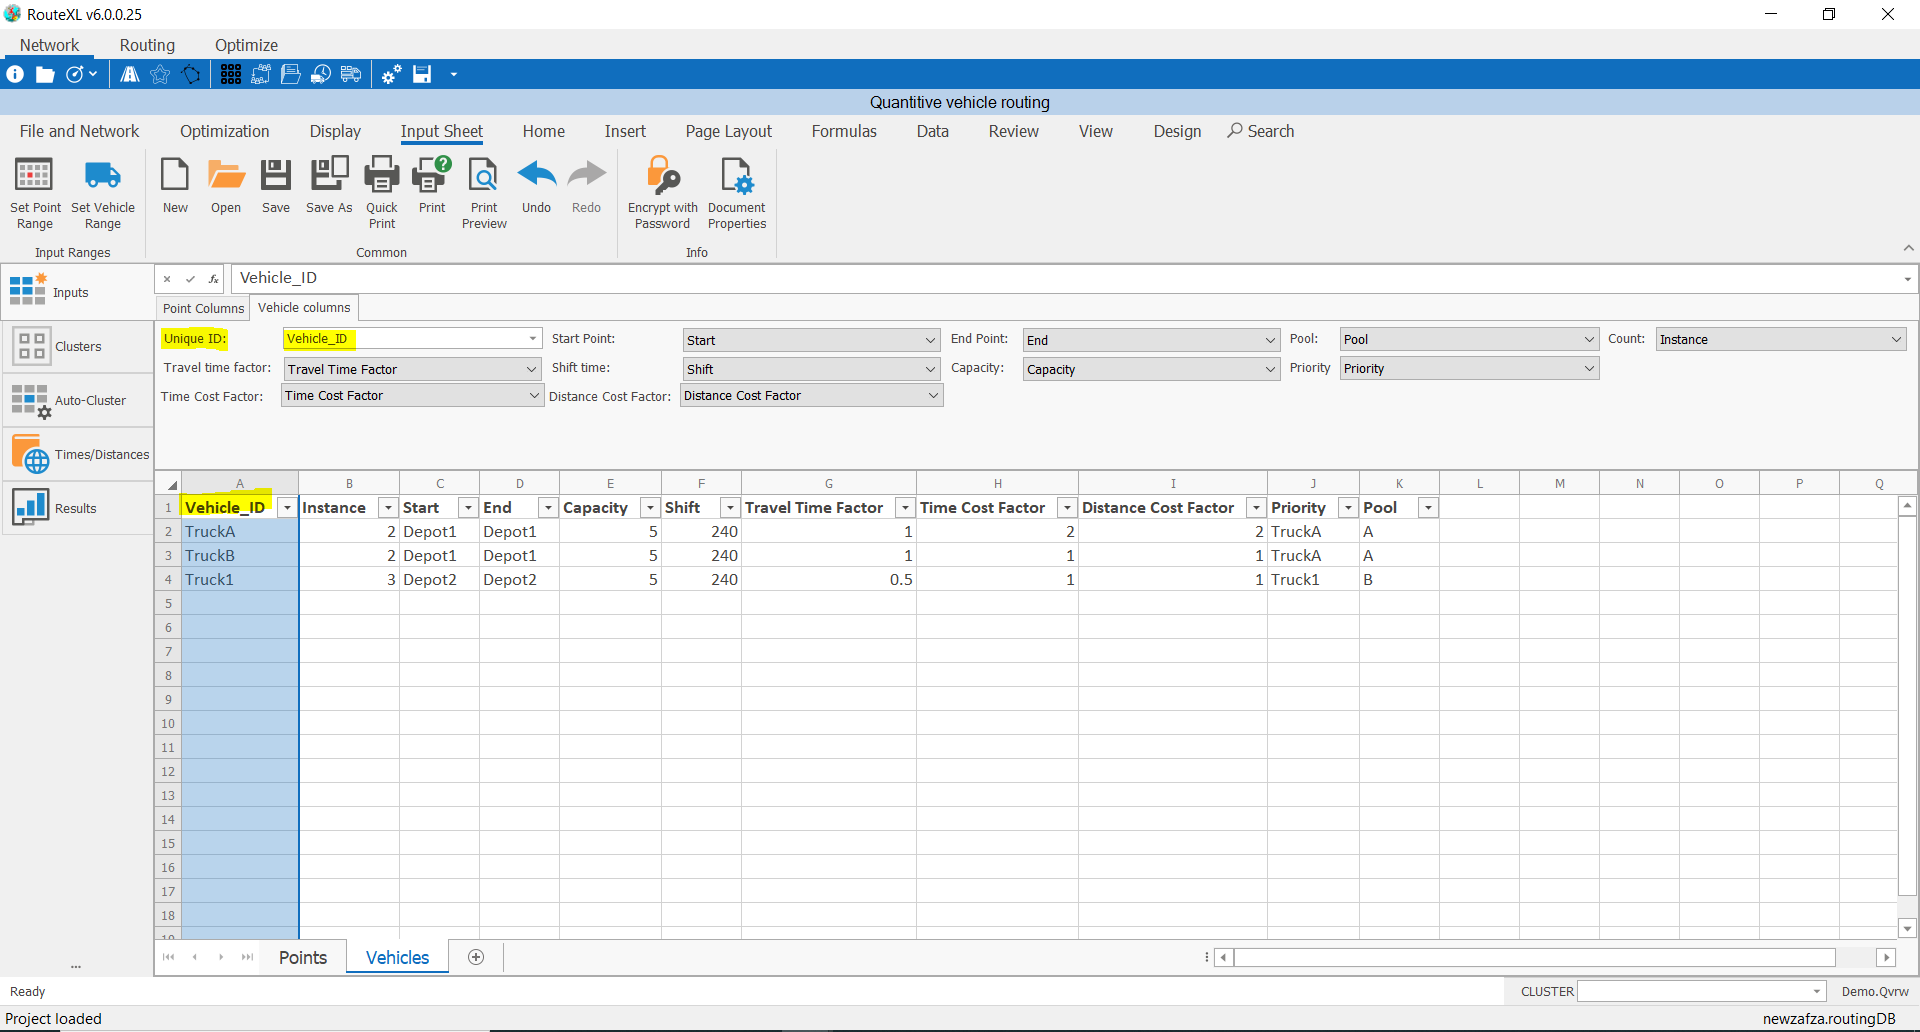
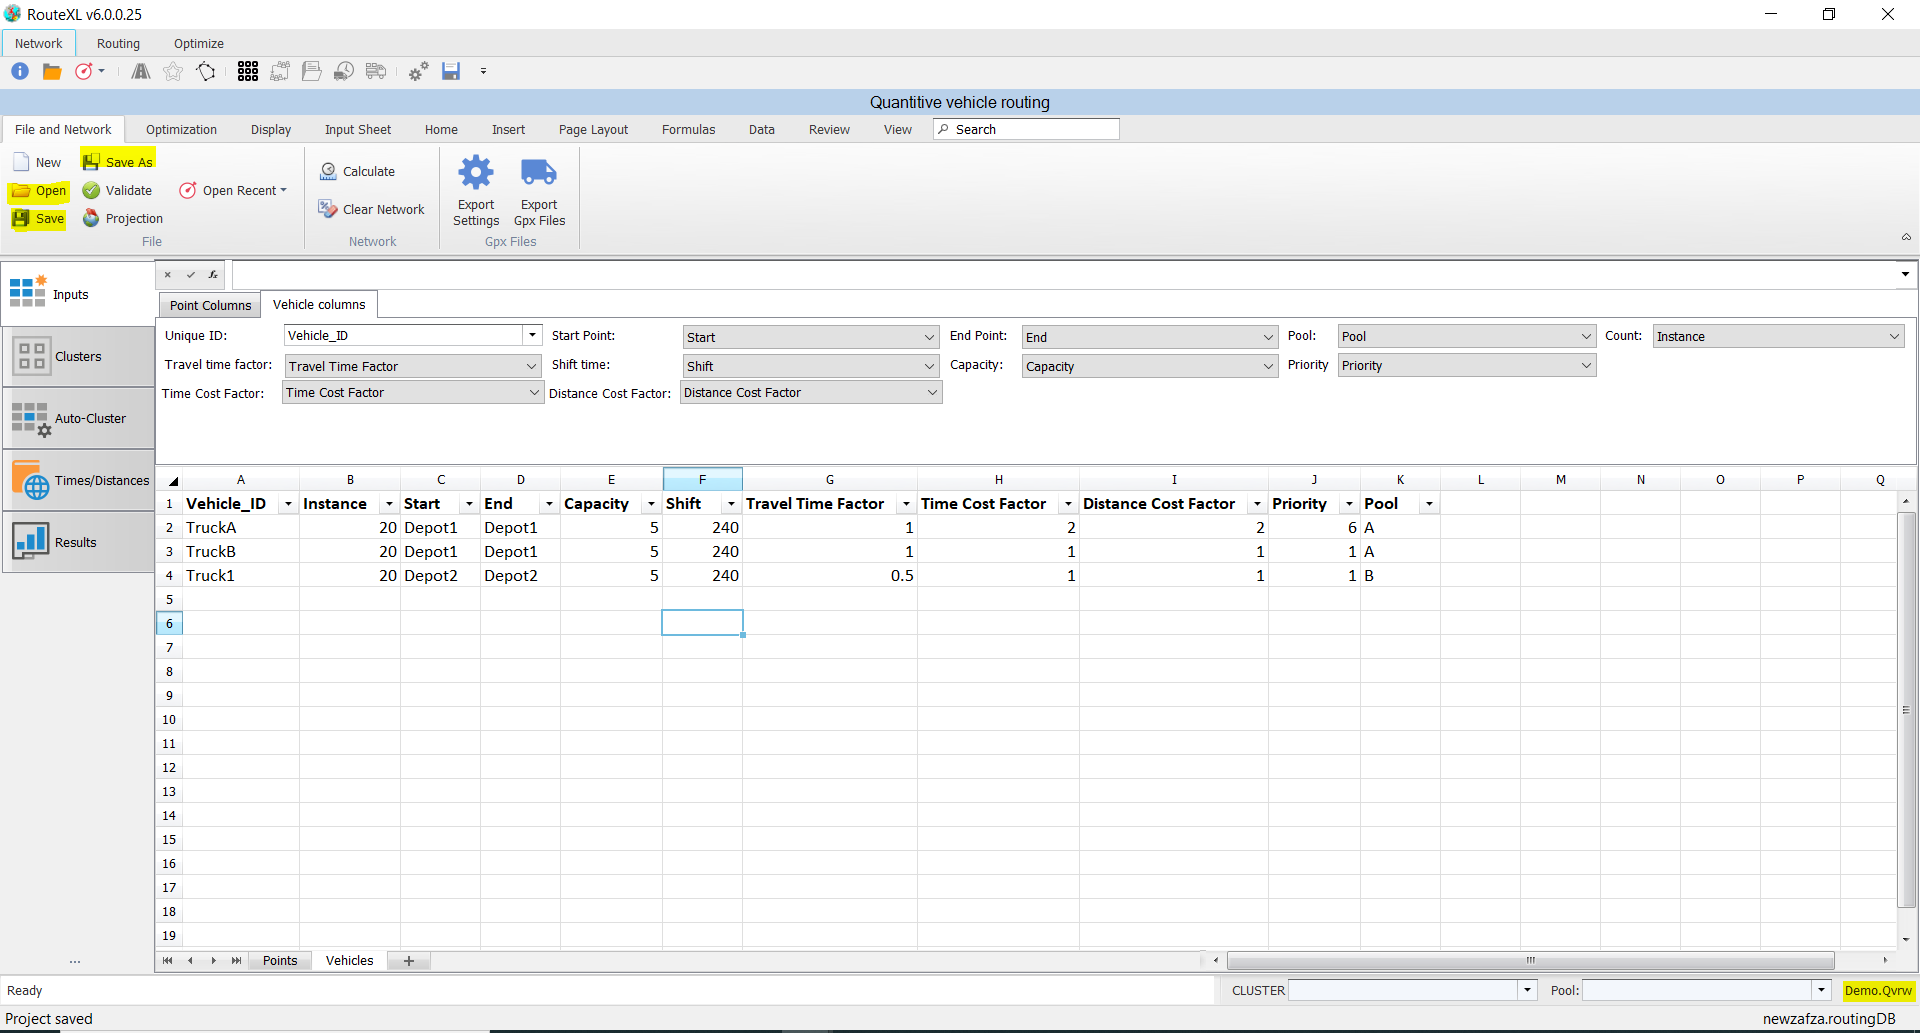
❖Set up Unique ID field by choosing Vehicle_ID. (Remember, these IDs need to be unique.)
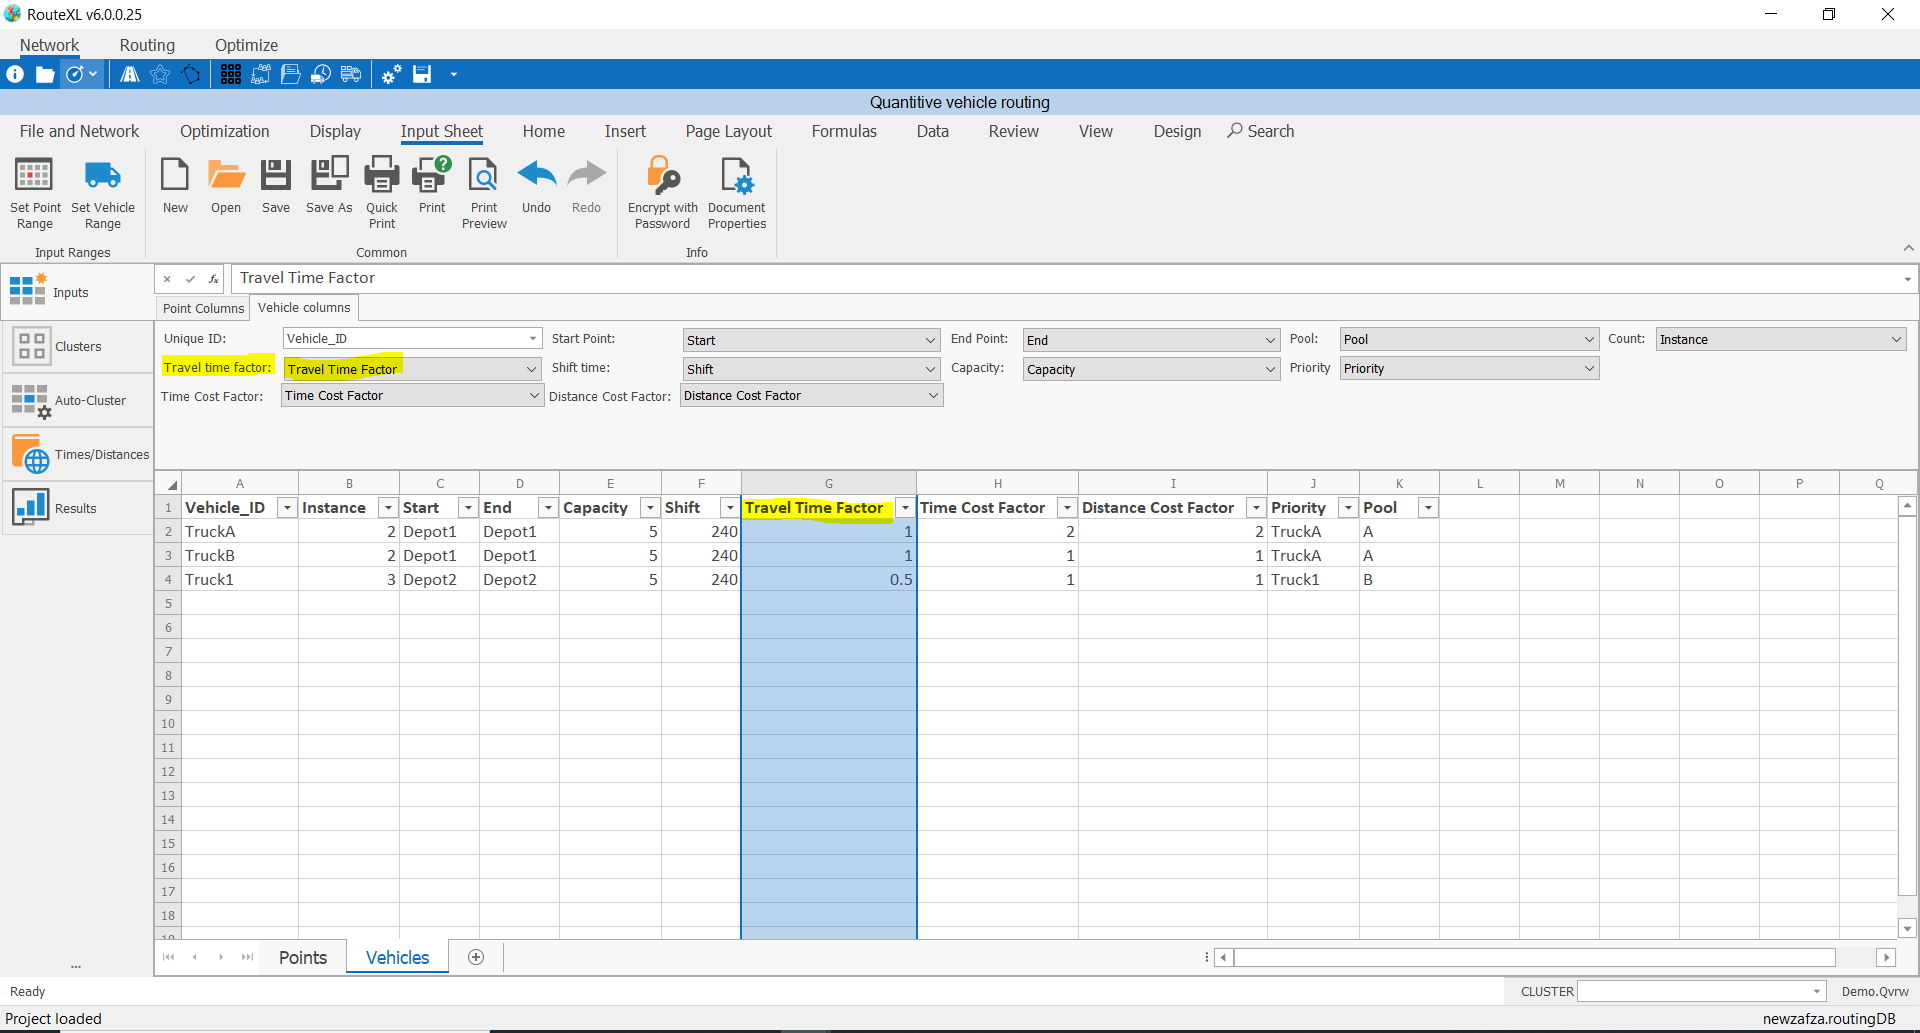
❖If you are wanting to adjust the travel time for a truck you can input per the above screenshot. A factor of 1 means no change. A factor of 0.5 would mean your truck would travel half the speed compared to usual in the road network - Maybe the area where this truck is routing would make sense that the truck is slower travelling.
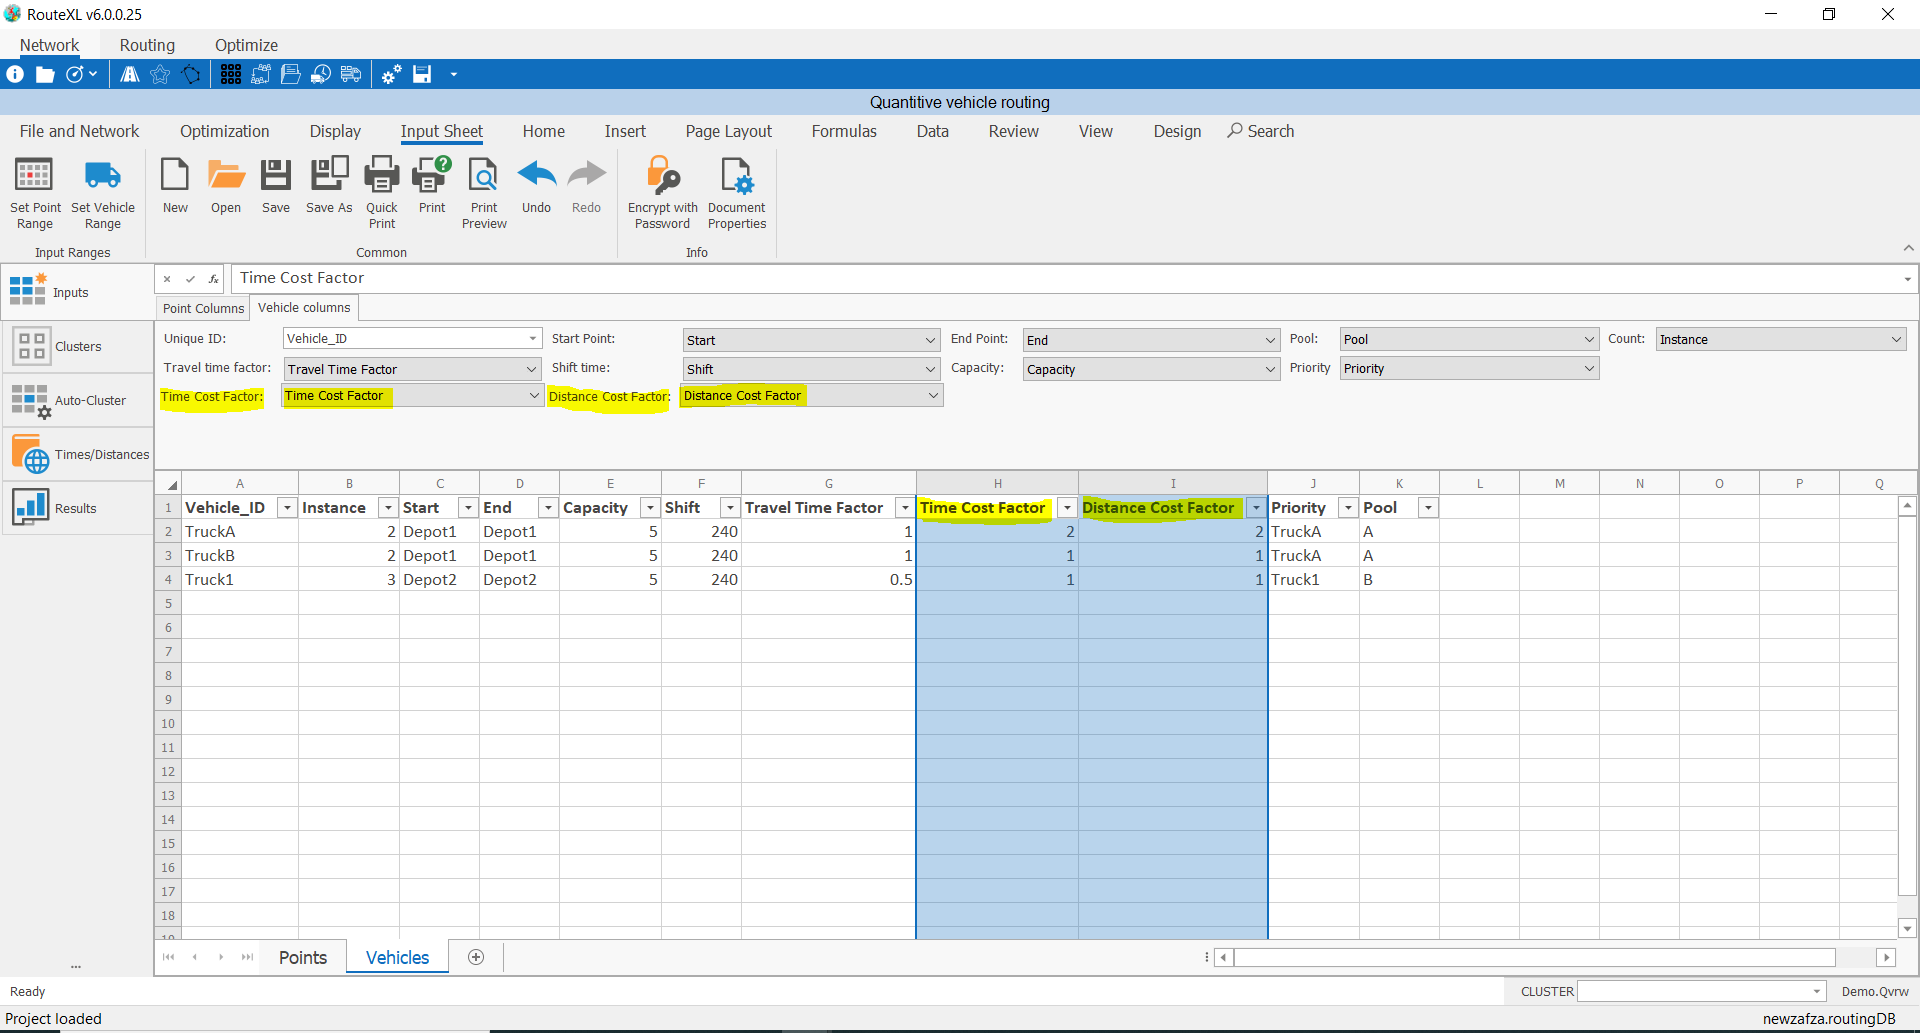
❖You might have a truck that costs you more in terms of cents per litre because it is a heavier truck, or it might cost you more the further distance it travels. Maybe you want the truck to travel slower and you don’t care how long it takes because it will save you costs. There are various things that could affect these factors and you would want the most efficient solution.
As you can see above, there are factors of 1 in the Time Cost Factor column and the Distance Cost Factor column. This is a default setting and wouldn’t change anything.
Note: These 2 columns, if you are using one or both, need to have at least 2 vehicles in a pool as you see above in the screenshot. So, we are focusing on Pool A as the example.
TruckA and TruckB are in Pool A. (We don’t care about Truck1 in Pool B as there is only one truck)
As you can see for both Time and Distance Cost Factor for TruckA is 2 and TruckB is 1.
This would mean TruckB would be forced to be used first when running a solution instead of TruckA in the pool. It is more cost efficient having only a factor of 1.
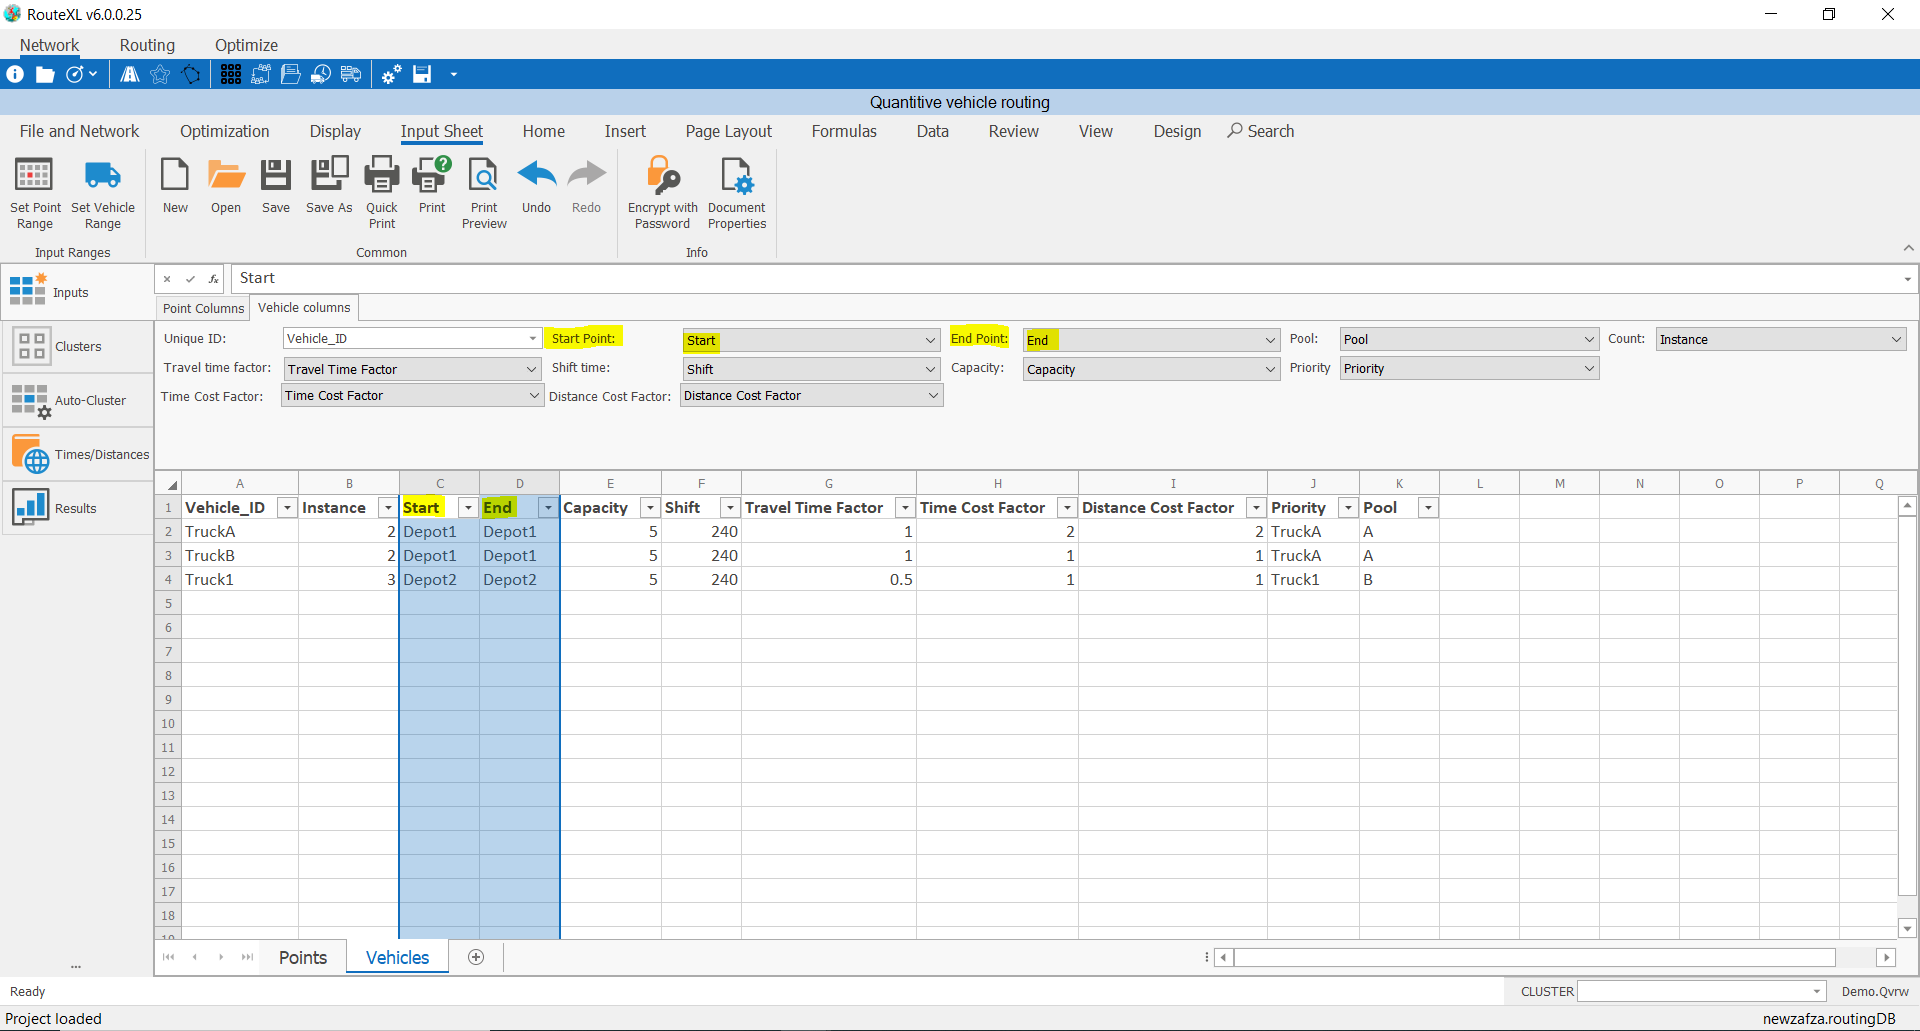
❖Set up your Start Point and End Point per screenshot above. This is where your trucks will start and end off in this example.
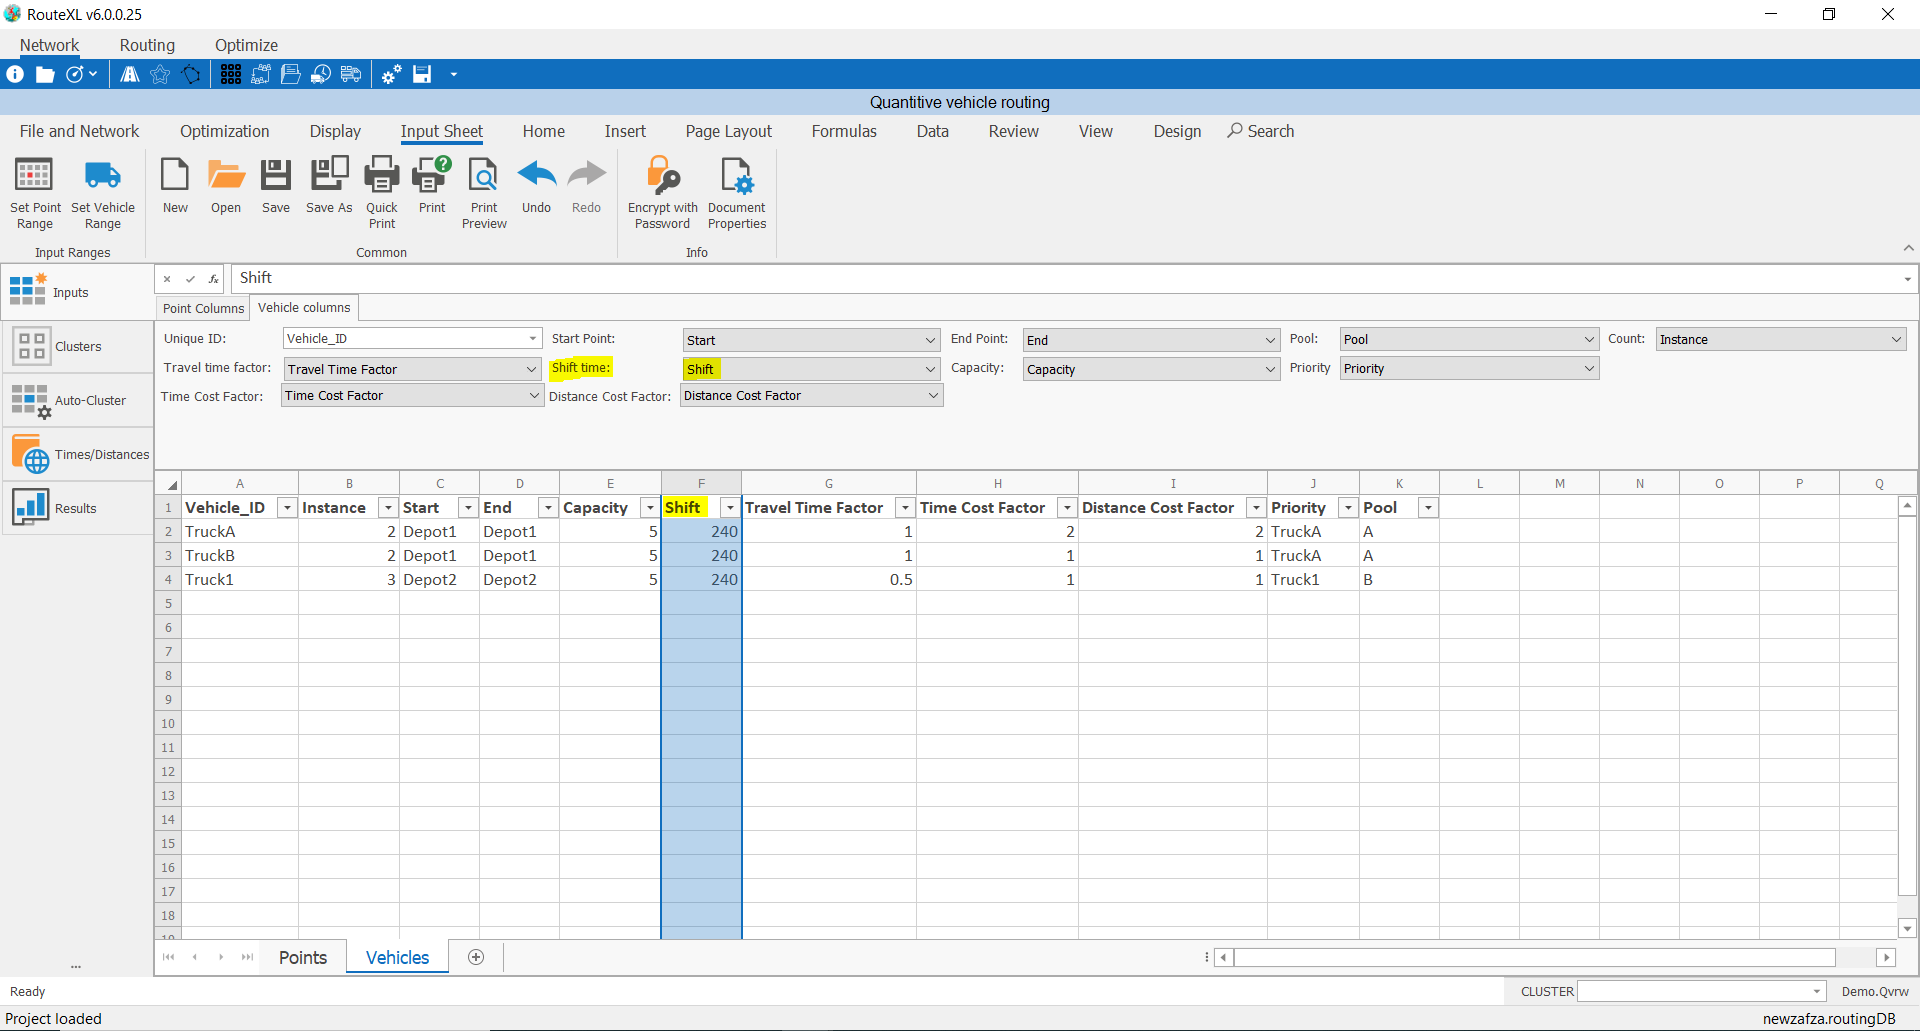
❖Your Shift time set up as above.
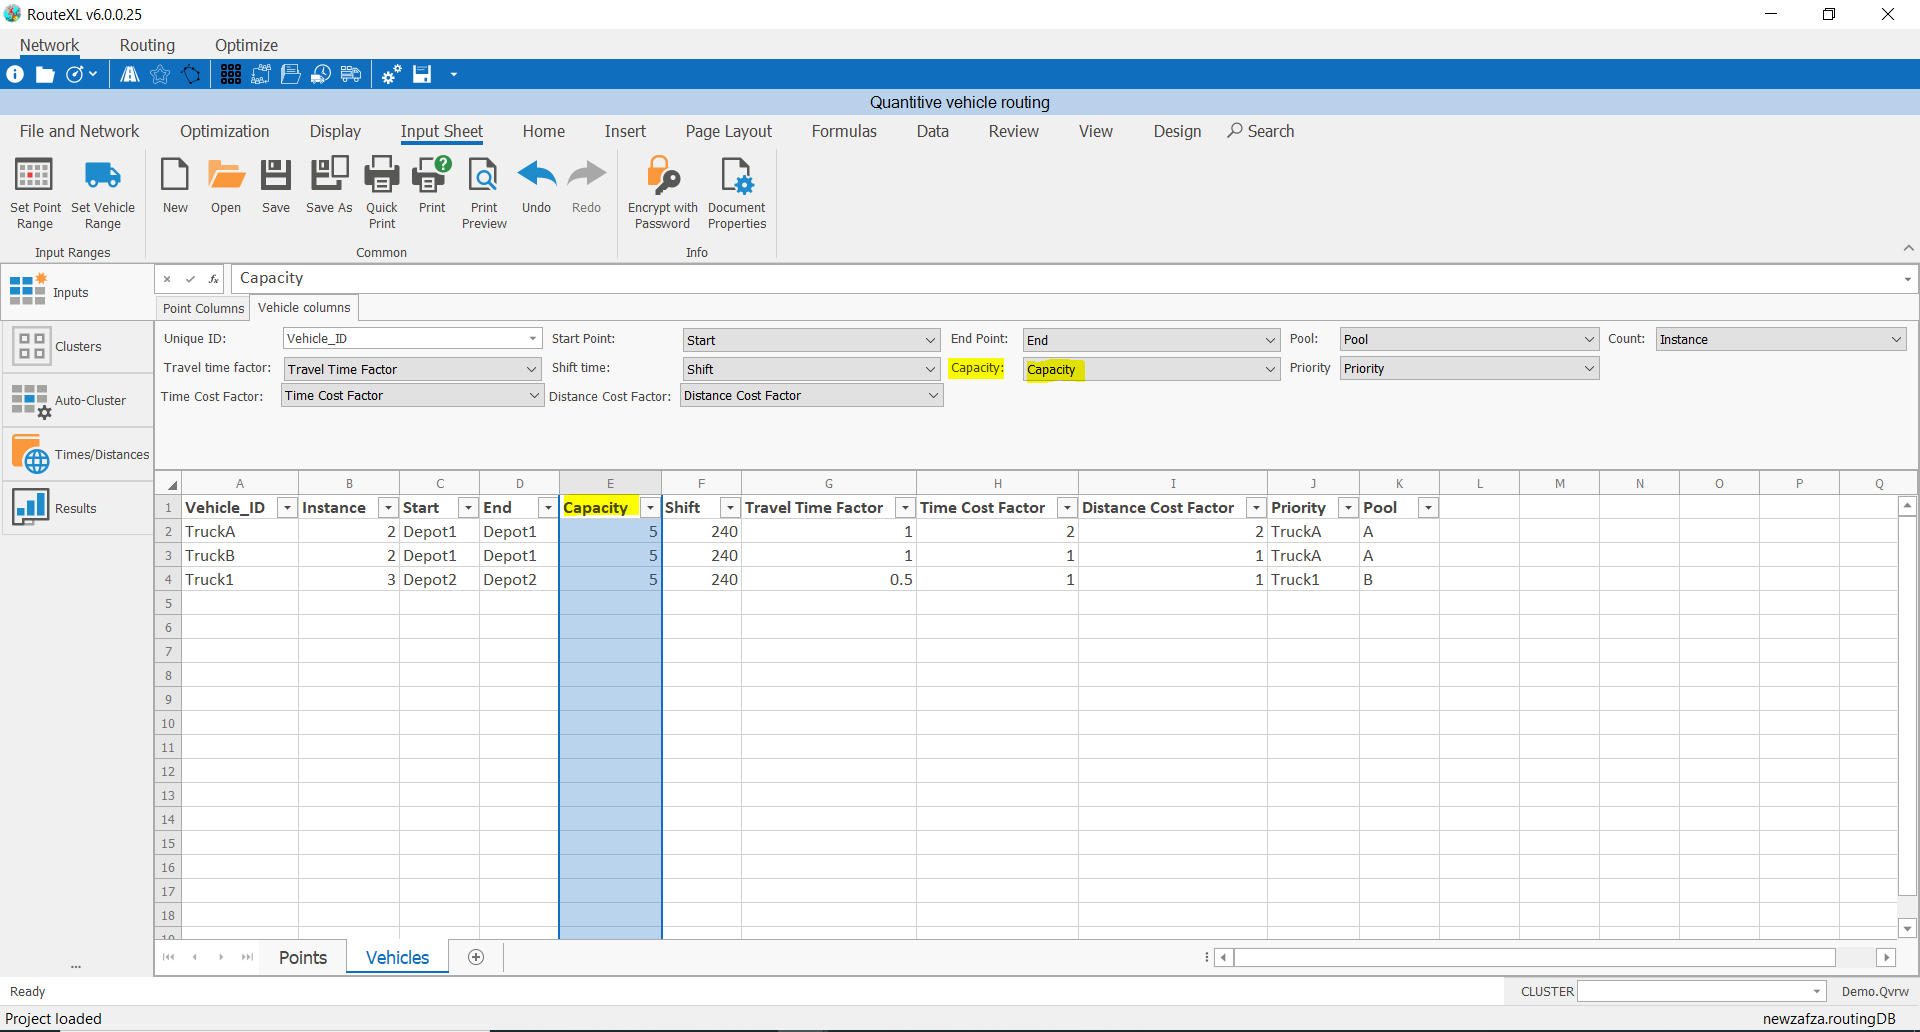
❖Your vehicle Capacity is set up as above.
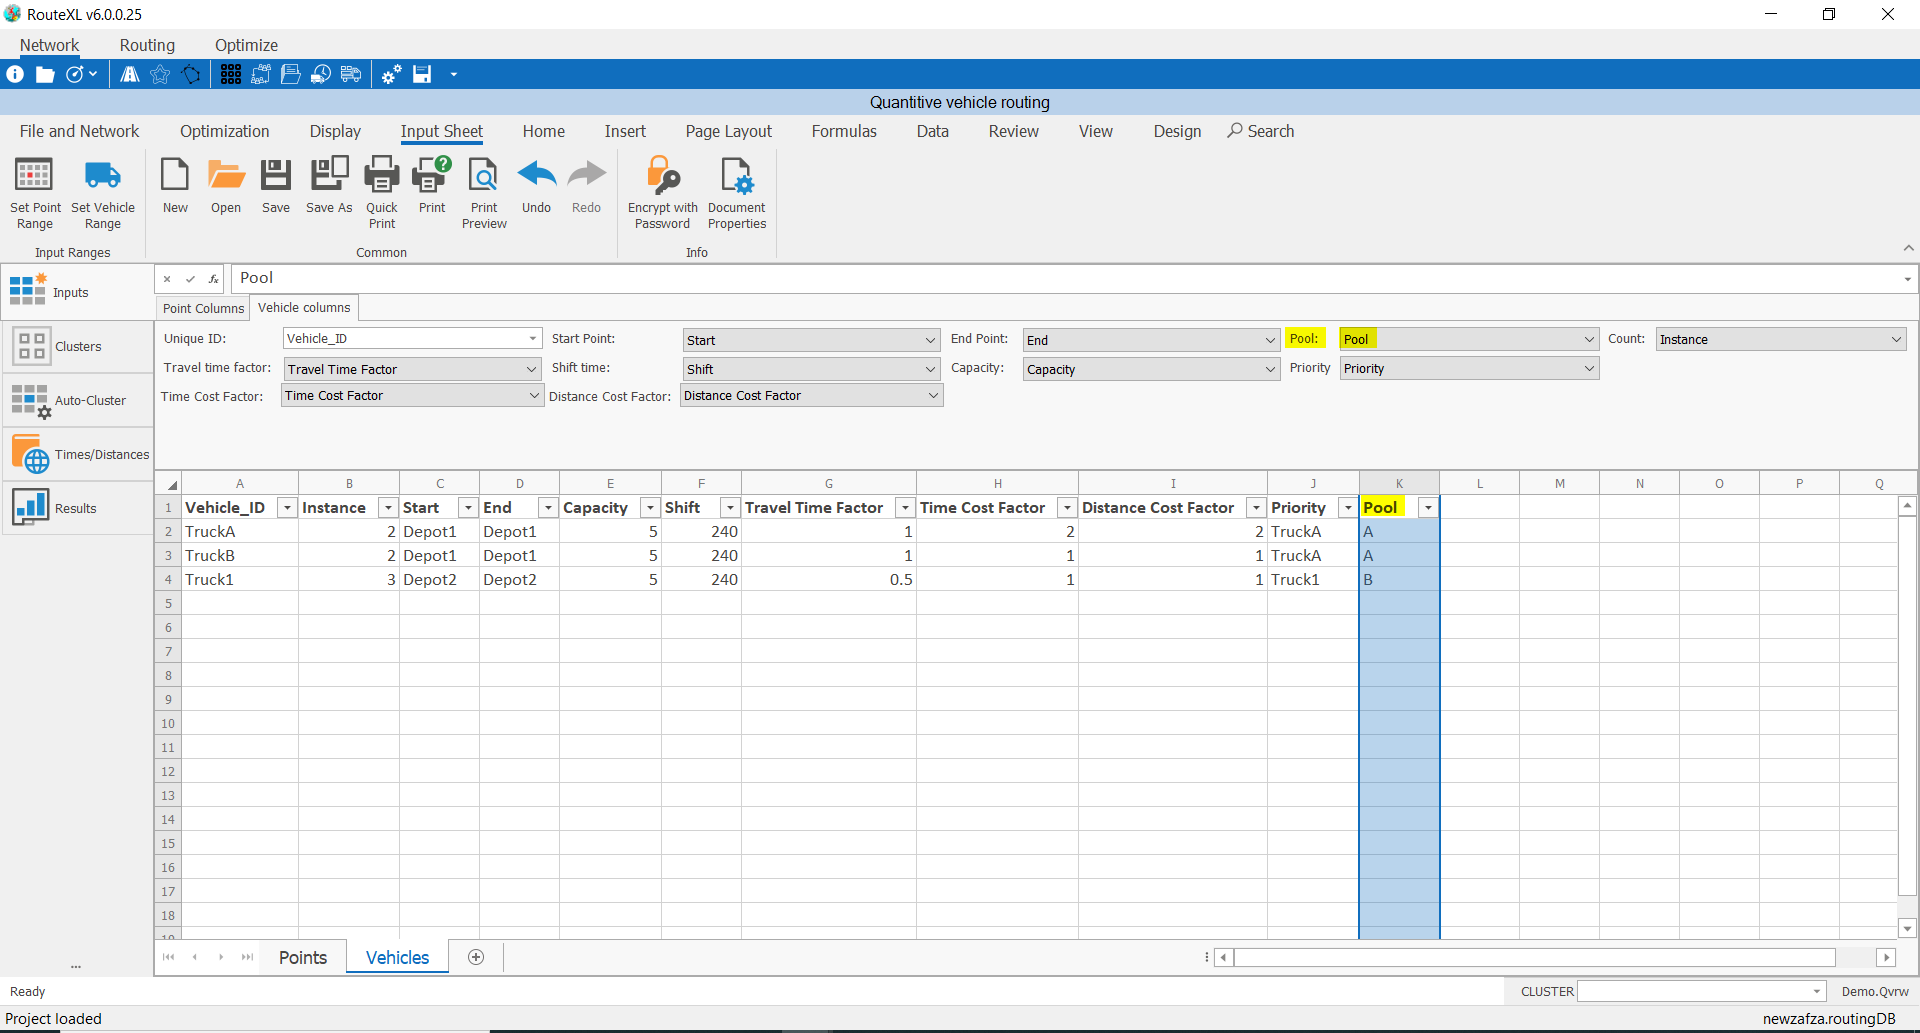
❖You can have one or more vehicles in a Pool as I have set up above.(Note: If you do have pools you just need to ensure that you do have a cluster column as we already set up in the Points Column tab.)
The idea is that you assign pool/s to clusters. For a certain cluster the vehicle/s in a pool assigned to it are only routed by those vehicles. A pool can also be assigned to one or more clusters at a time.
❖Therefore, you need to go to your Clusters tab and assign you pool/s to your cluster/s as the next step.
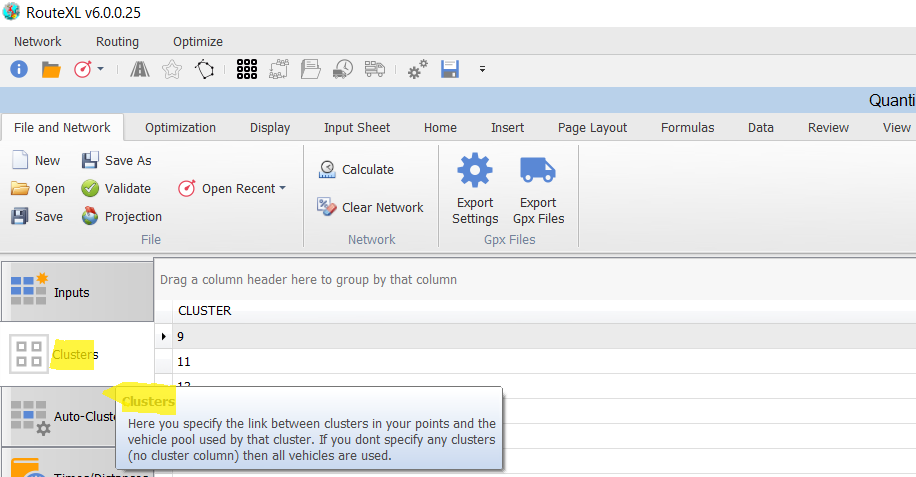
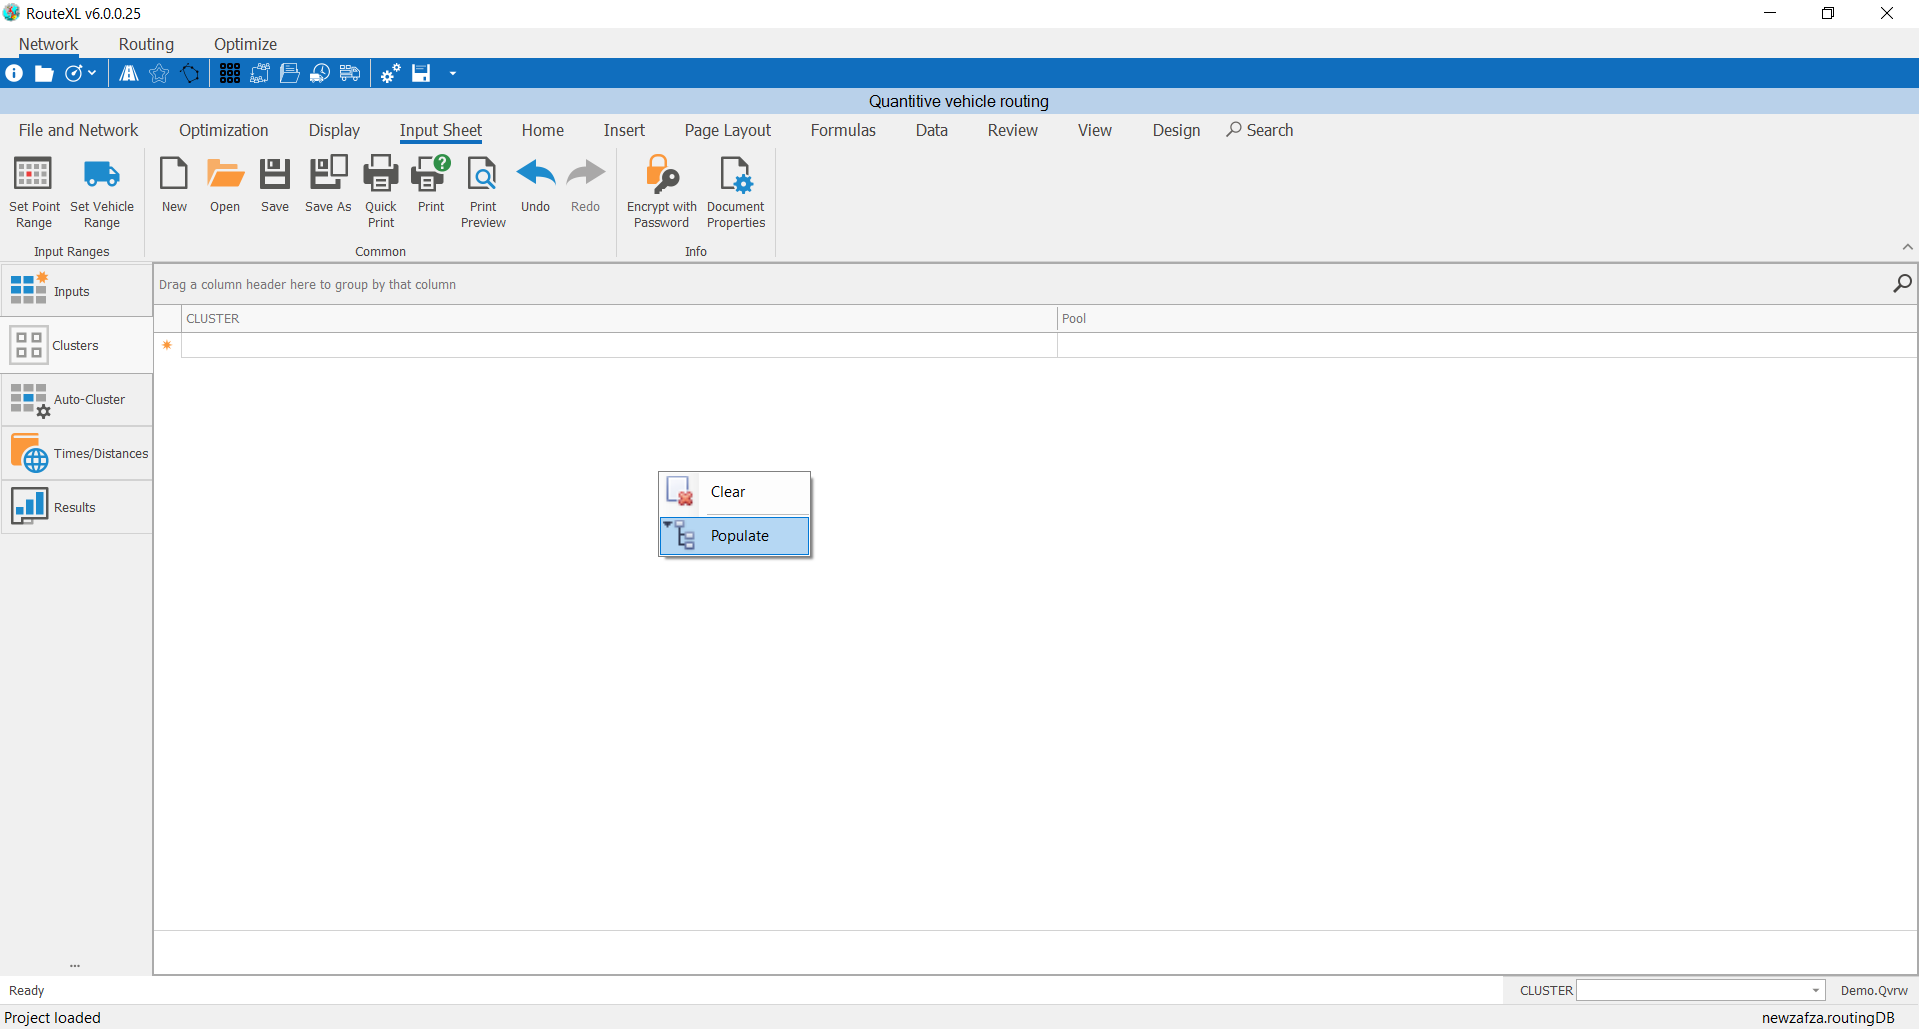
❖Right click in the area and select Populate. This will populate all your clusters.
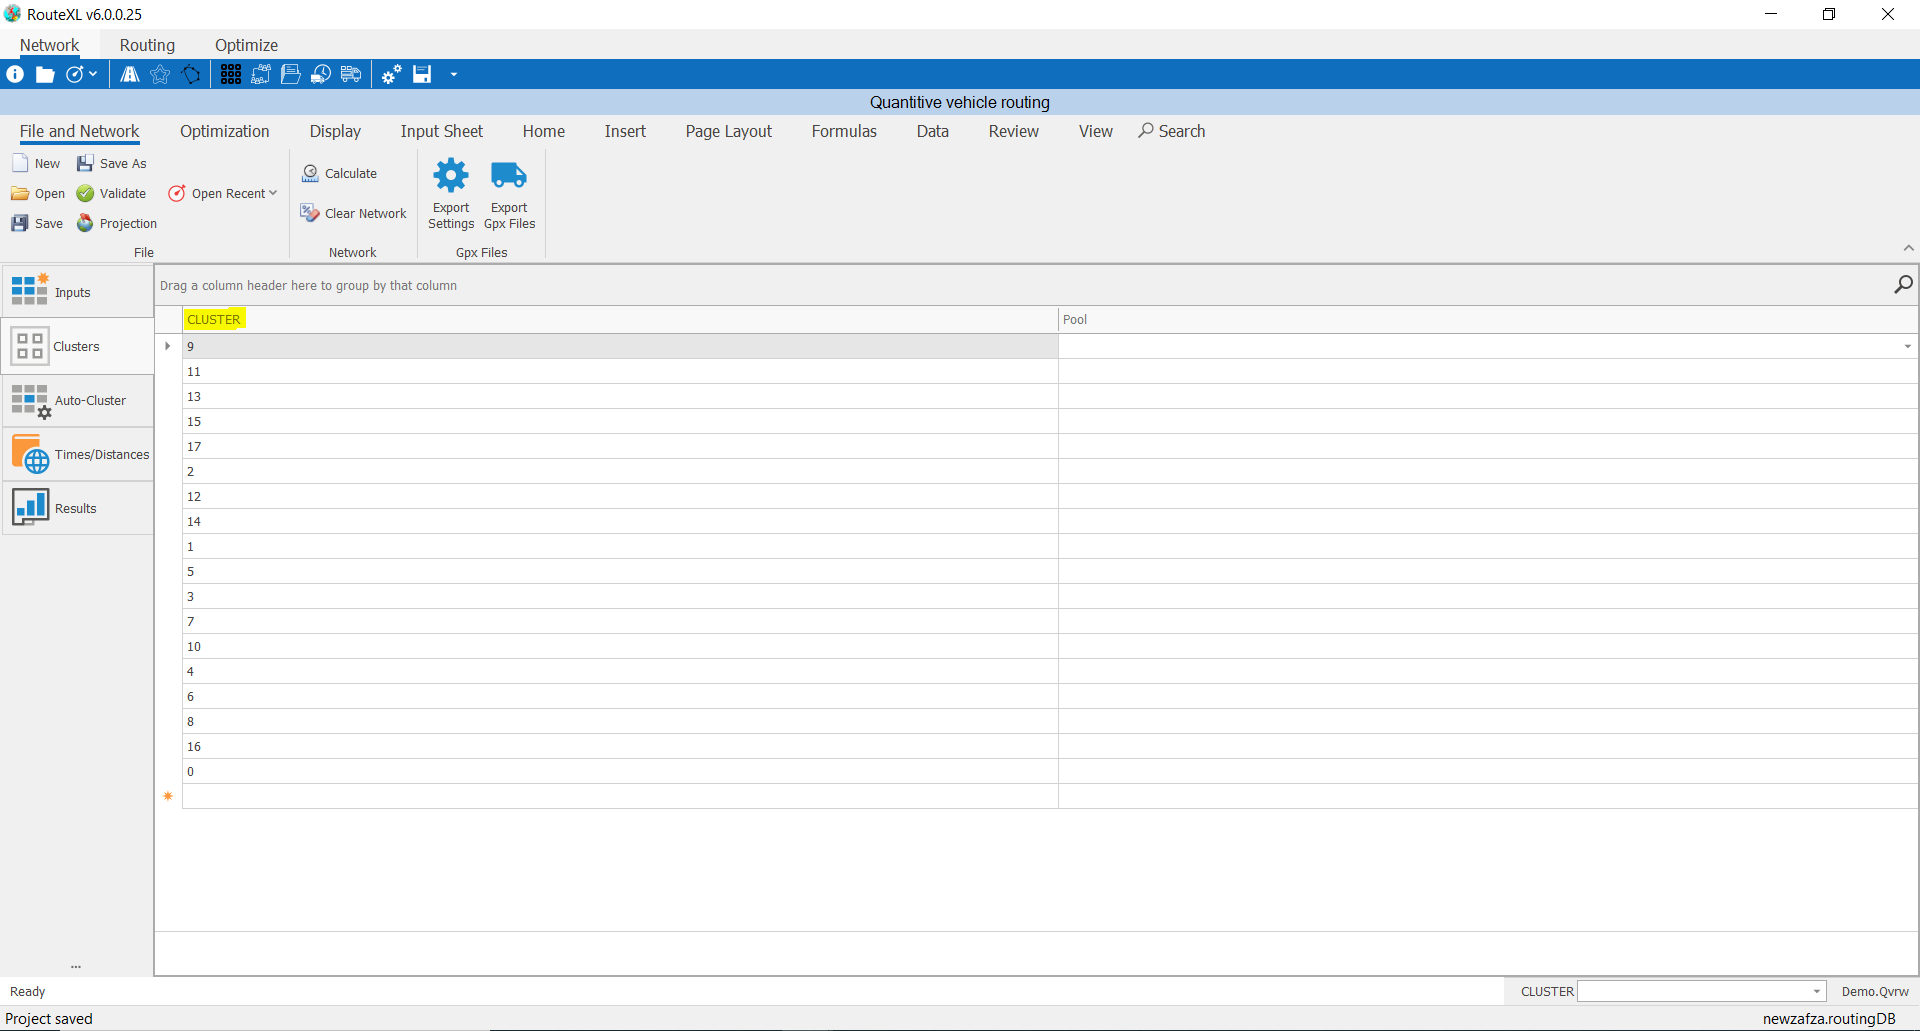
❖Fill in your pools by typing it in exactly worded as in your Vehicles sheet. You could also copy and paste it in which will make it faster.
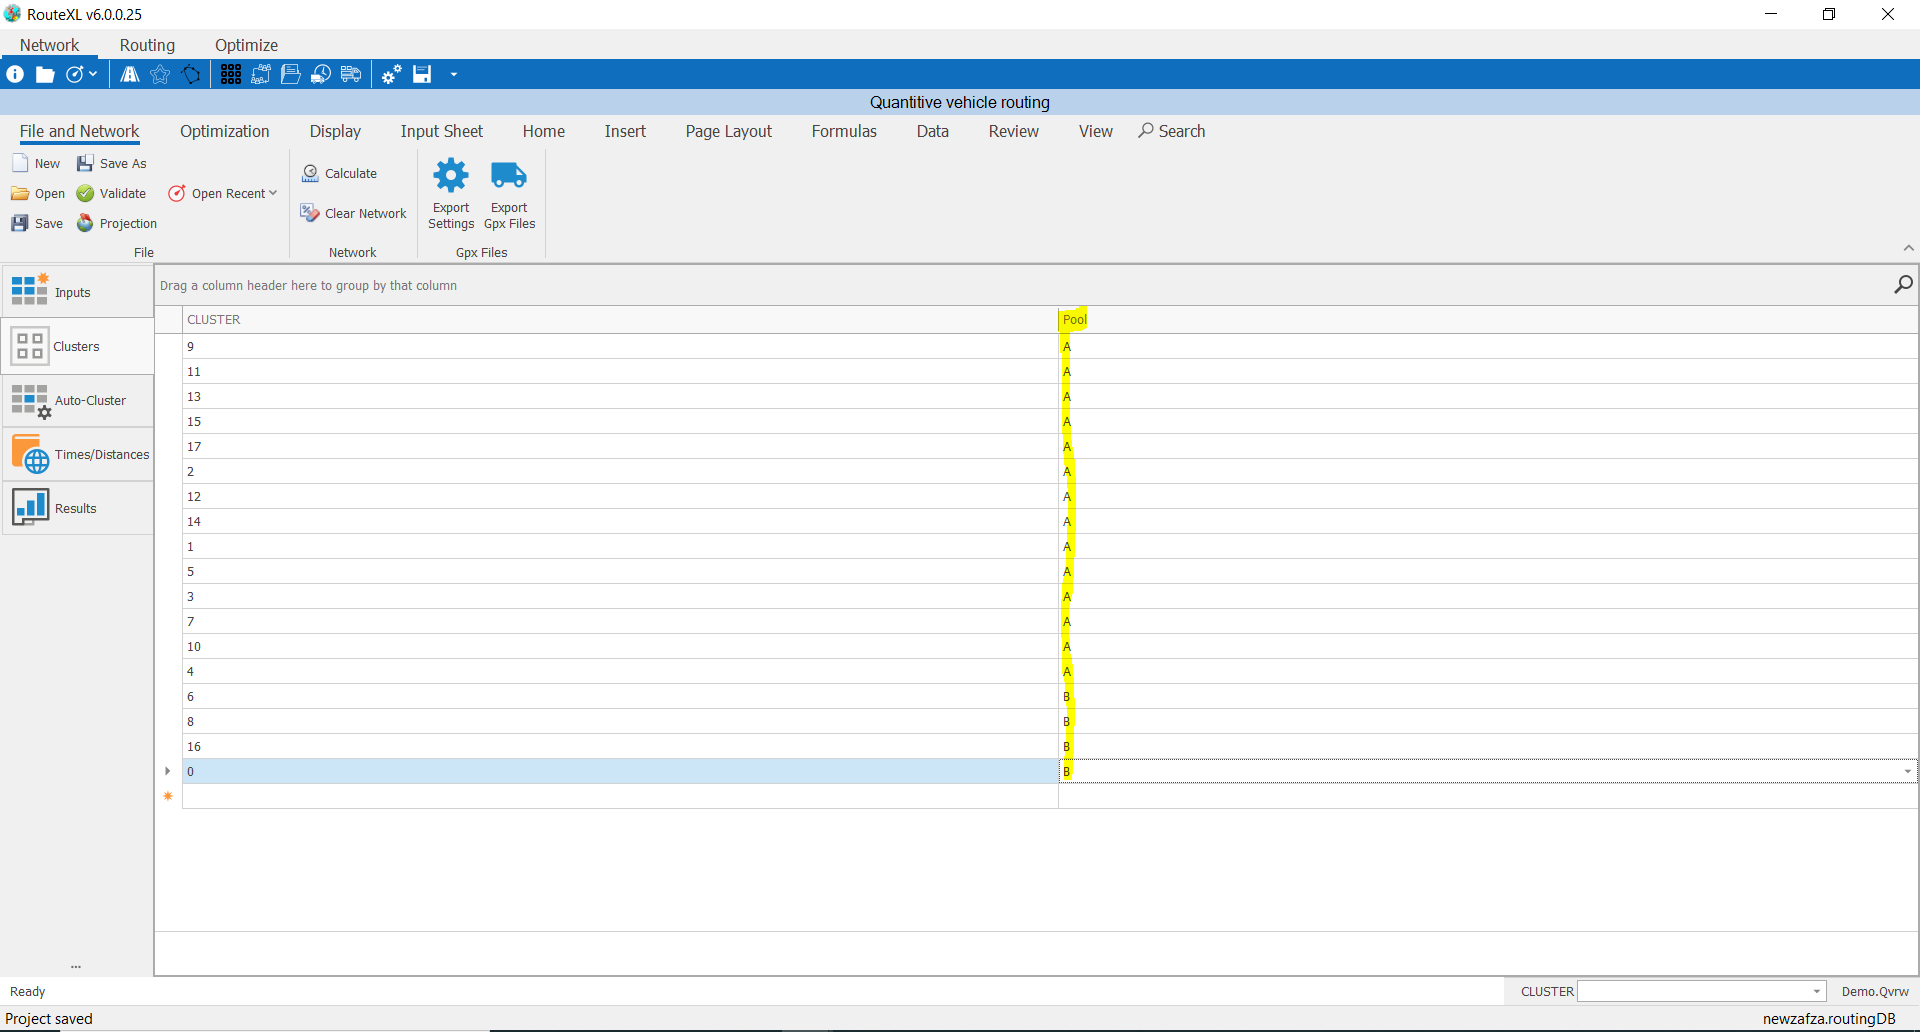
❖You are done with this set up in the Clusters tab. Now, let’s go back and complete the set up in the Vehicle columns tab.
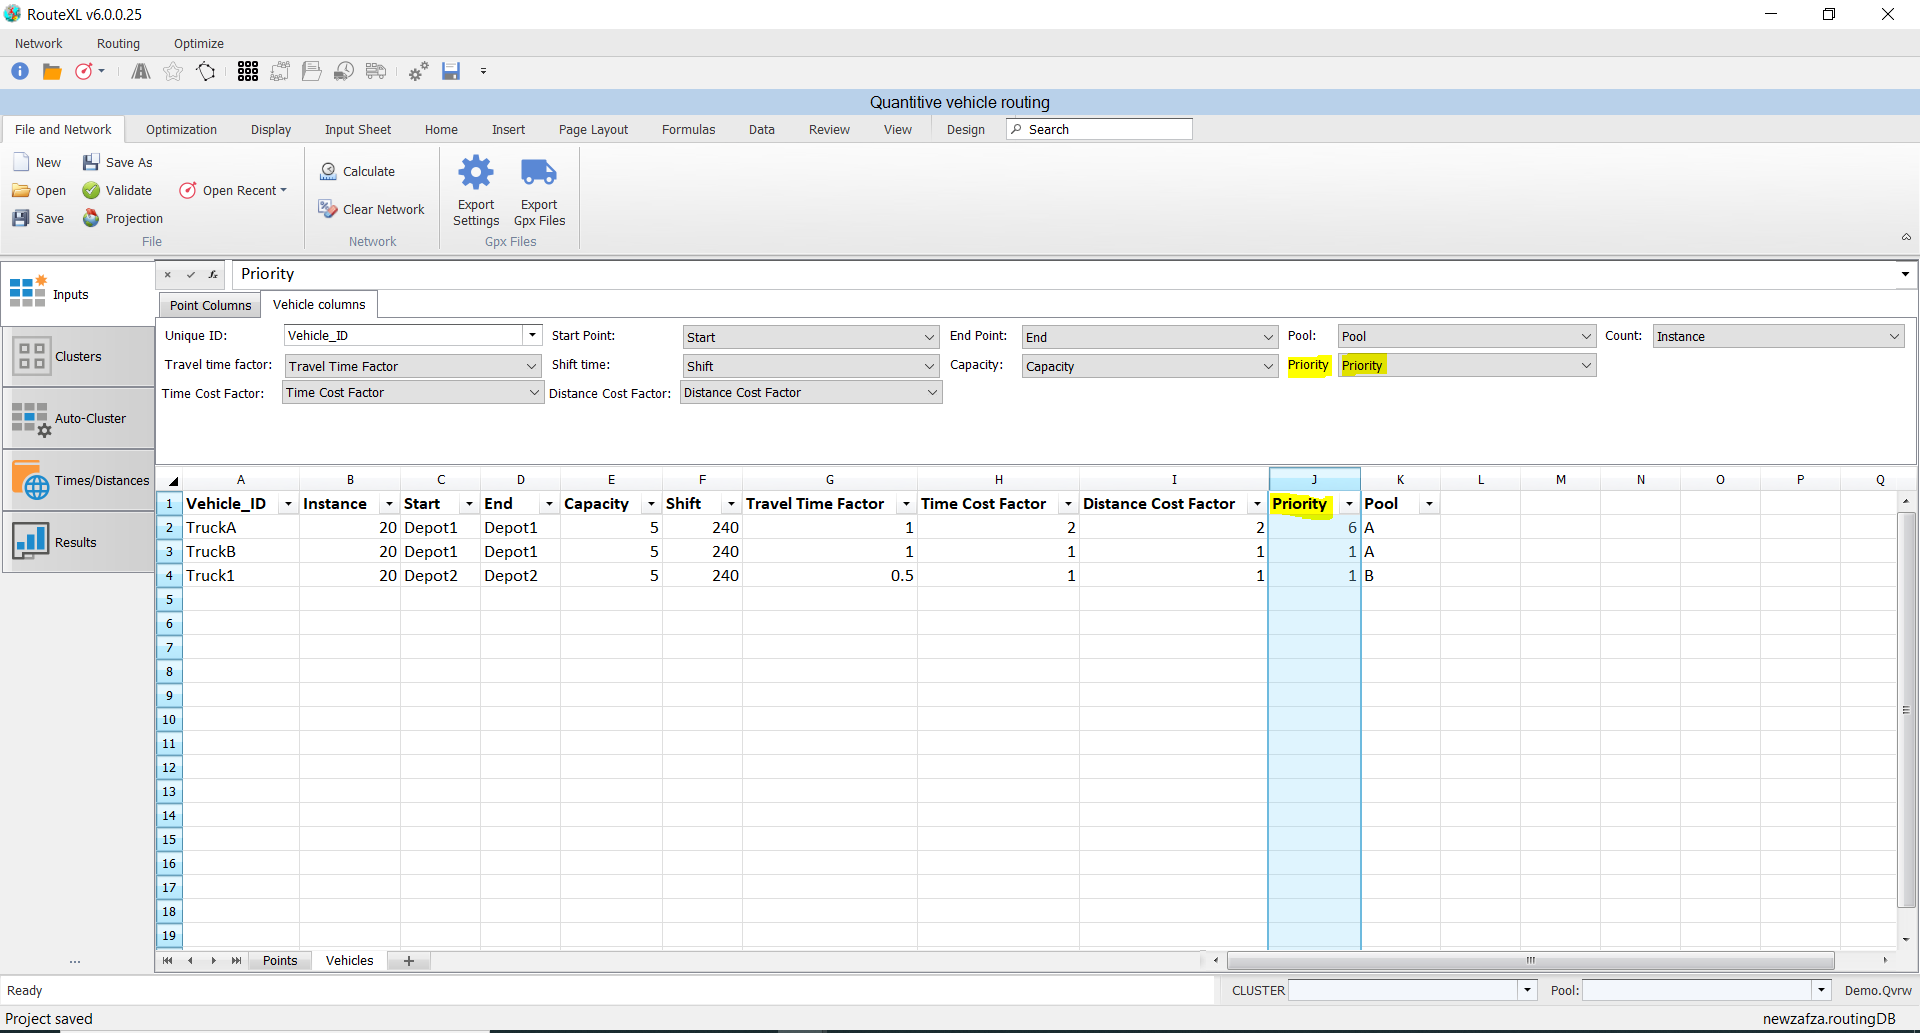
❖There is a Priority column that you can have set up as I did per the screenshot above. Higher priority vehicles get chosen first. In Pool A, TruckA has a priority of 6 and TruckB has a priority of 1, therefore TruckA will be used first.
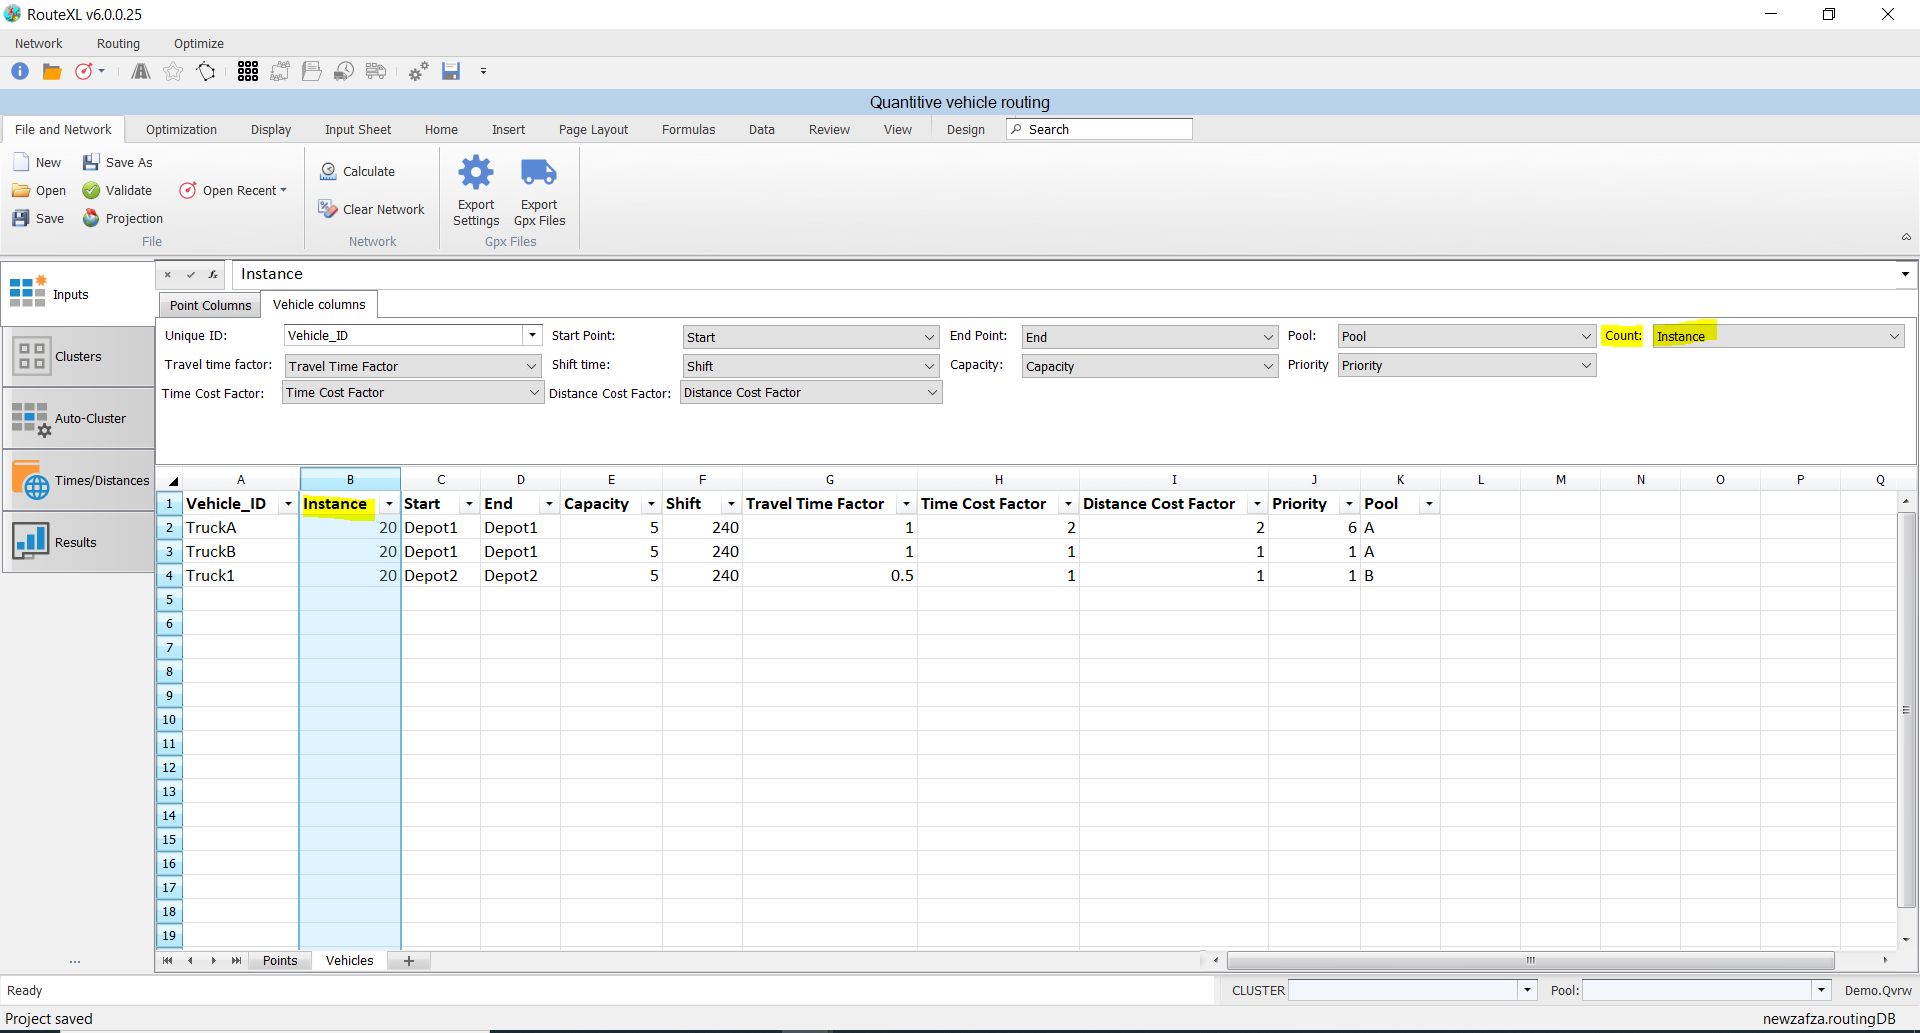
❖Setting up the column Count is useful if you have more than one instance of a vehicle/truck. For example, if a truck goes out and does what it needs to do and comes back to the depot and completes it’s shift that would be one instance.
If there were 3 instances of a truck then that is basically 3 shift times completed, therefore you would probably need 3 of those same trucks for that day. Or 3 shifts completed of the one truck over 3 days. This is a concept of how it works.
(Note: You can have many trips a day of a truck to and from the depot within its shift time and when that’s complete that is still one instance. The Count field set up could also be used as the maximum number of trips a truck can do. It all depends on what solution you want to get out. It is very dynamic.)
❖Your Points Columns and Vehicle columns have been fully set up. (Note: Again, you don’t need to use all fields. Just make sure if you don’t have that field in your sheet or don’t need to use it at this point, always select <None>. Don’t leave the fields blank.)
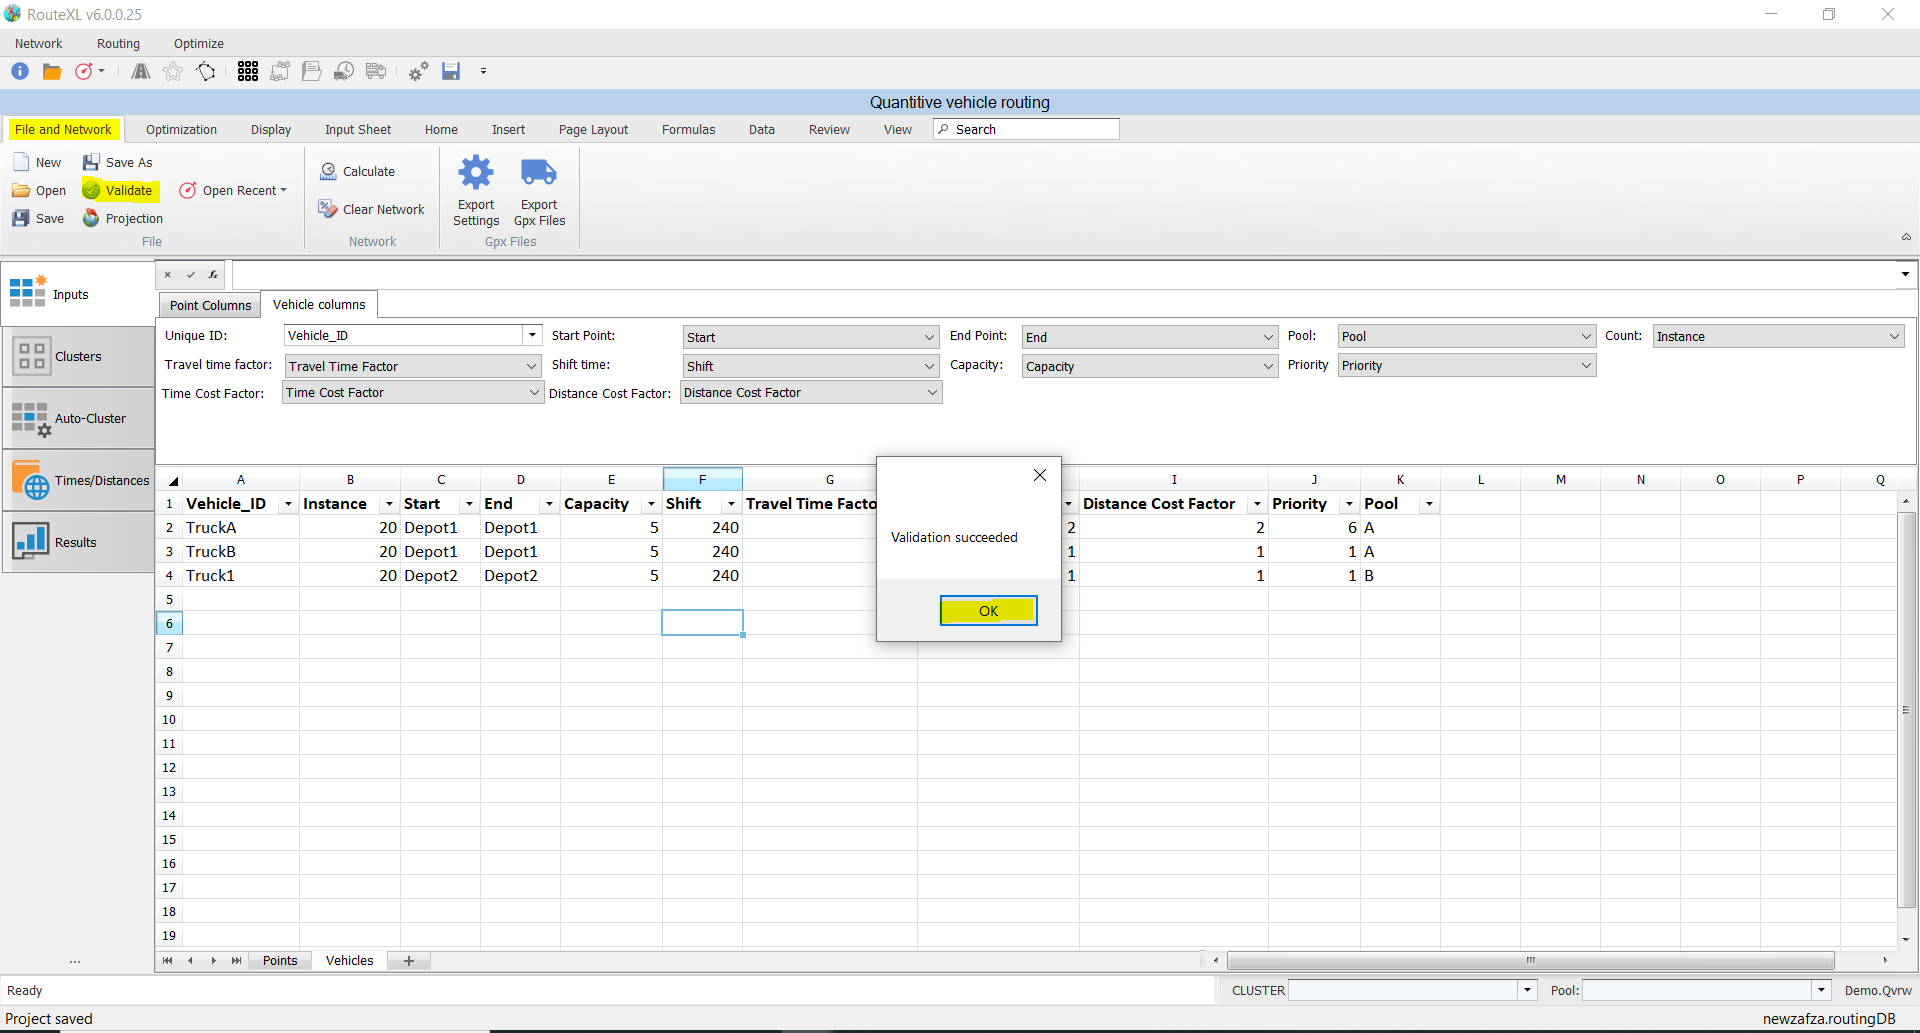
❖To validate your work to ensure everything is set up correctly in your Points and Vehicles sheet etc, select File and Network tab and click on Validate. If there is an error, you will be notified and can adjust your set up. If it succeeded it will notify you too as it did in my example below. Click OK.
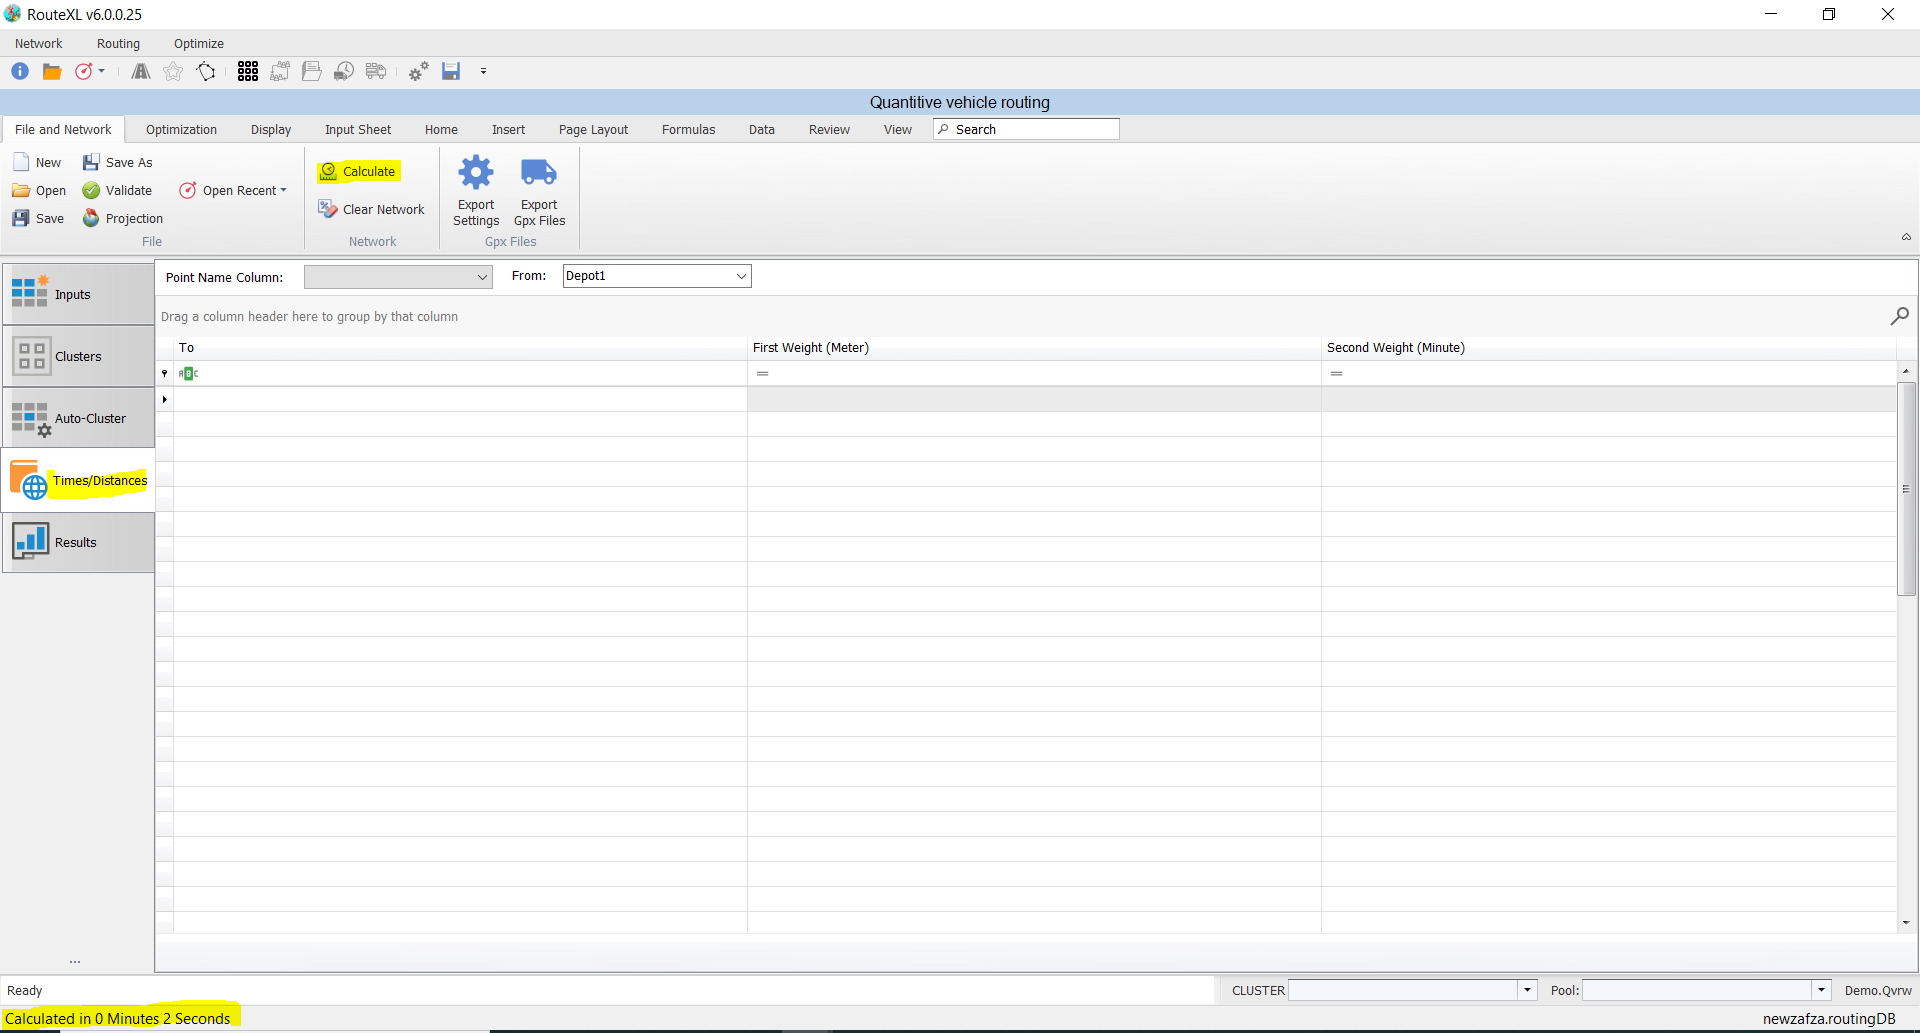
❖You need to Calculate your routing network now that you loaded earlier. Click on Calculate.
❖You will see that it has successfully calculated or is calculating by viewing the bottom left of your RouteXL window. You will automatically be taken to your Times/Distances tab when this is complete.
❖You should save your work now at this point, so you don’t lose anything that you have set up including calculating your routing network.
Save it in an appropriate location. You can then just load this project again at a later point. Your project is displayed at the bottom right hand corner of the RouteXL window.
❖Let’s move onto the Optimization tab as you are now ready to do your routing based on your various parameters that have been set up.
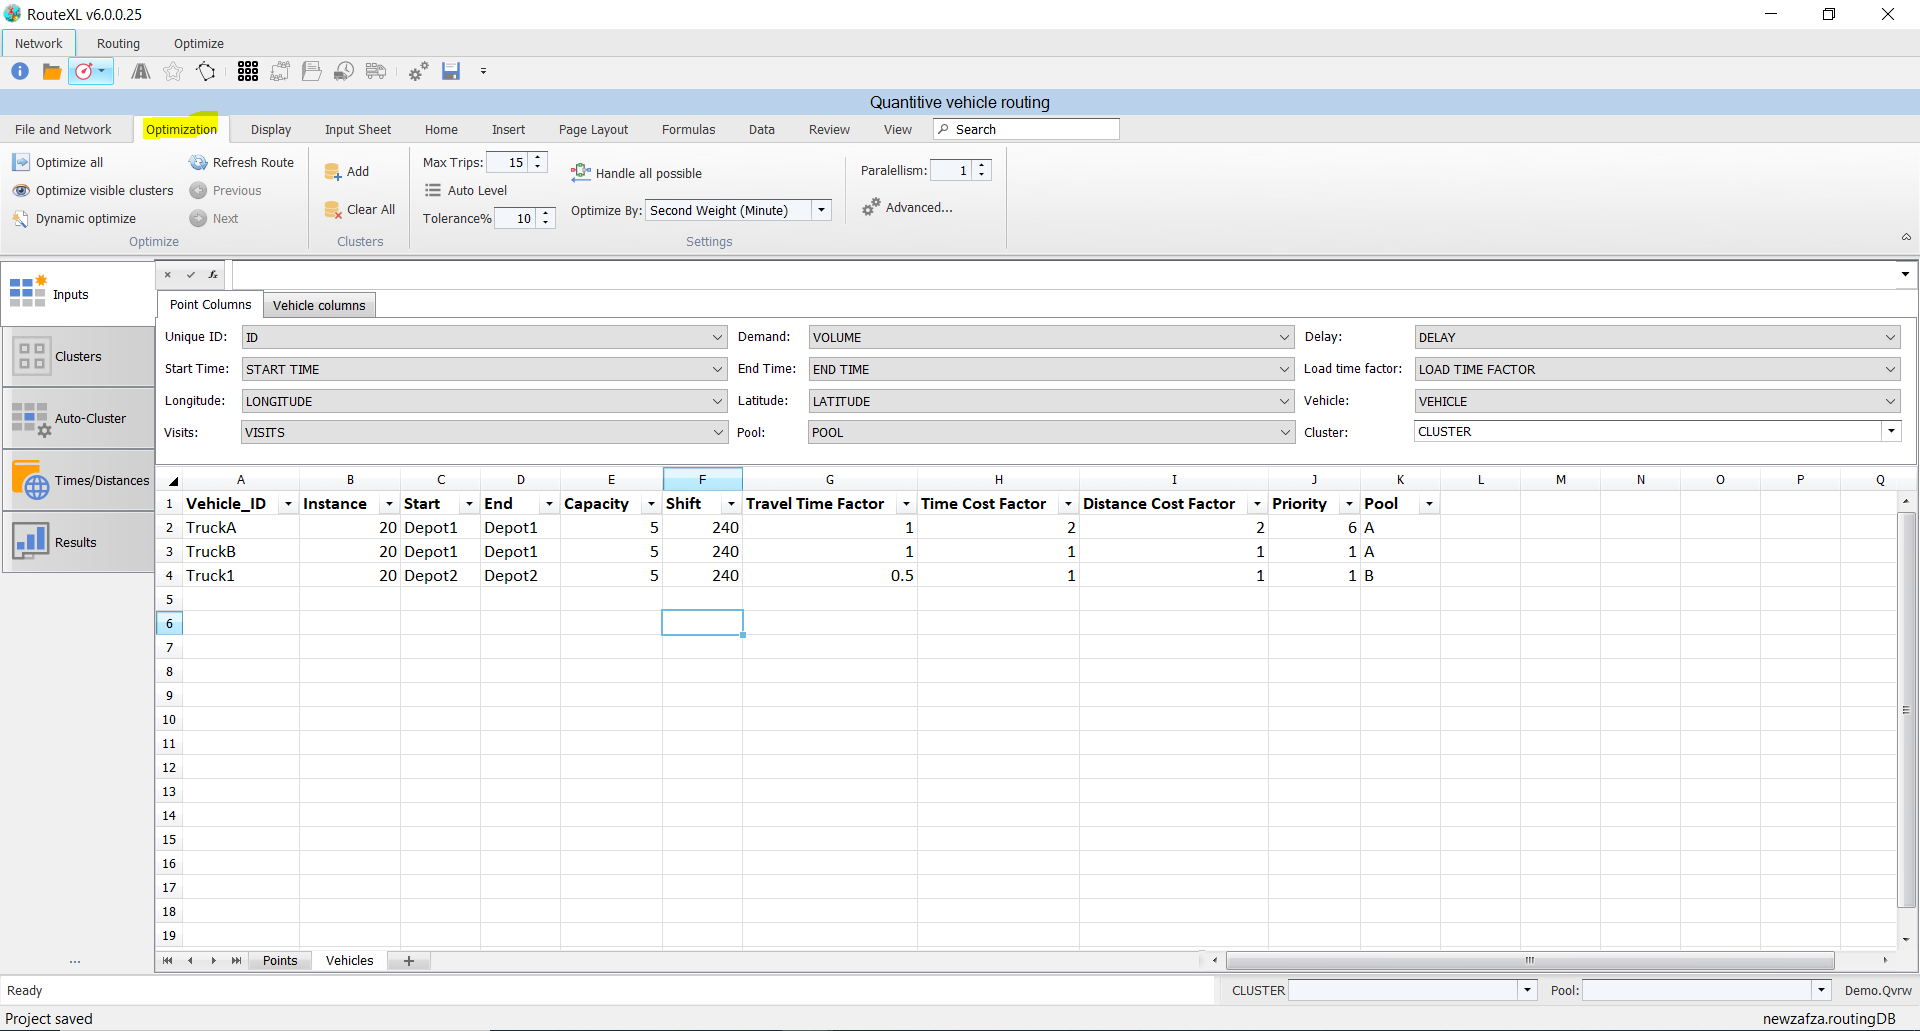
❖Below are screenshots of settings that are set at default with an explanation of each. You can adjust these based on what output you want from your routing solution.


(Parallelism I have found not ever needing to adjust. This default setting is best)
❖If your Auto Level button is selected it will do the following, otherwise it is by default off.


❖This button is by default off but can be selected if you are wanting a solution per the description of it. This is useful to have on if you have many points and want to get a solution for what you can in the meantime, instead of spending so long to find a solution and it failing with no results at all.
(Note: This process can take a while if the button is selected compared to running a normal solution. It also depends how many points you are routing. The more points the longer it will even take.)
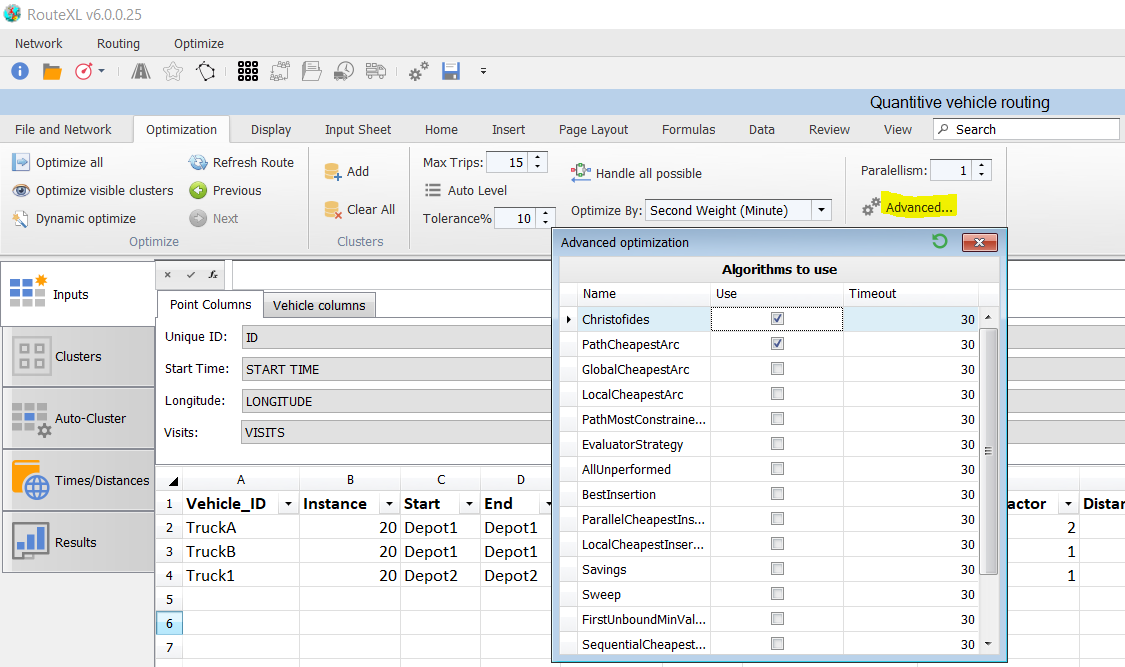
❖The next setting in the screenshot below is set at default. You would change it when you are routing a lot of points. In this case, you would use just Christofides and not PathCheapestArc. It is the best algorithm to use and you would get a solution faster compared to using 2 algorithms at the same time. (You have a choice of many algorithms to use as well.)
You might also want to increase the Timeout. (It is measured in seconds and shows how long is needed to find or produce a solution) You would want it set higher when routing a lot of points so there is enough time to find and/or produce a solution with results.
❖At this point you are ready to optimize your routes and get a solution and results out.
❖If you have set up Pools and Clusters which I have in this example, you would only need to use the button Optimize all to get an entire solution. You can export all your routes thereafter to your map.


❖If you would only like to get a solution and results for a cluster or a certain number of clusters instead of all of them, you can do the following:
1.Go to your Display tab and select Points. All your points will be displayed on your map with QVRW Points layer created.
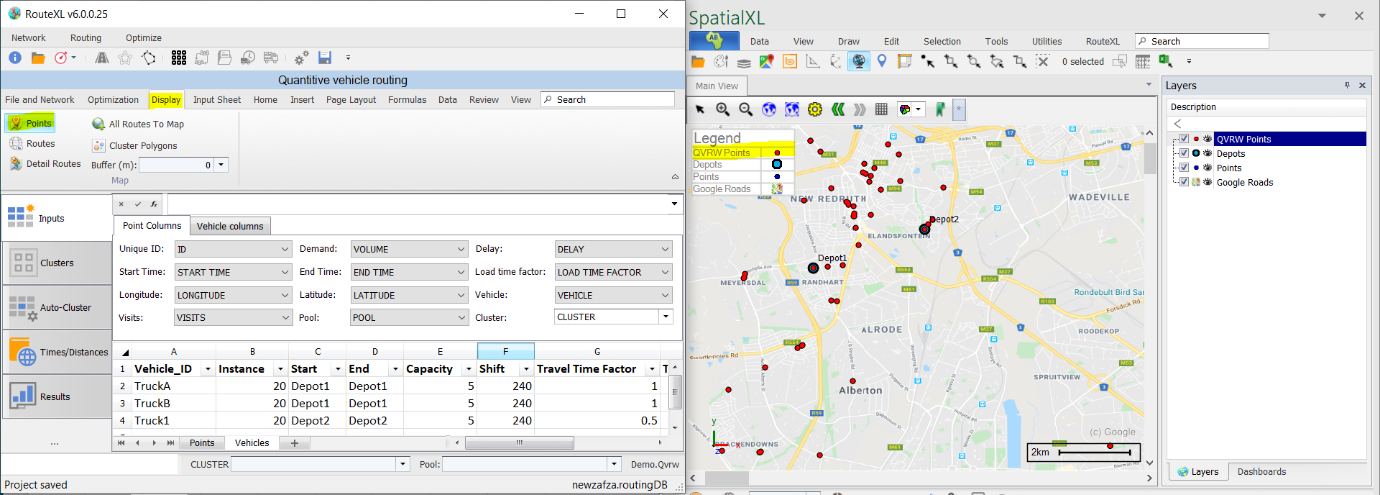
❖Create a colour theme on the column Cluster and select what clusters are visible on your map. Here is an example:
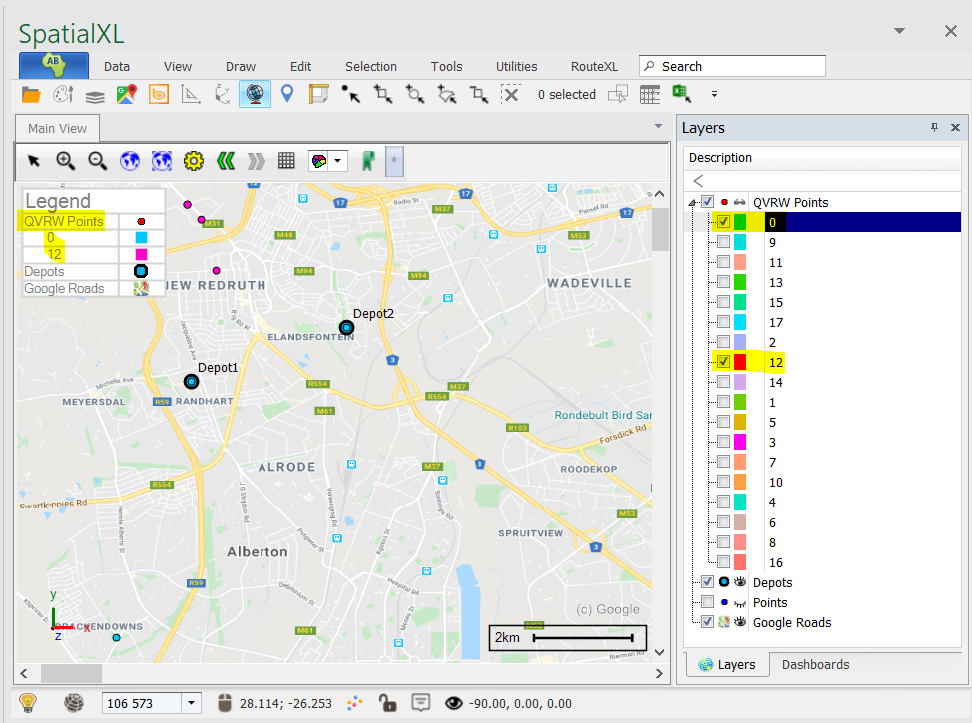
❖Go back to your RouteXL window and now select Optimize visible clusters which will do just that.

❖The button Dynamic optimize is used per the description of it below (make sure to select it first if you are using it so you can display Points etc.) (Note: You can only use Dynamic optimize if you are not using Pools, otherwise you will get an error.)
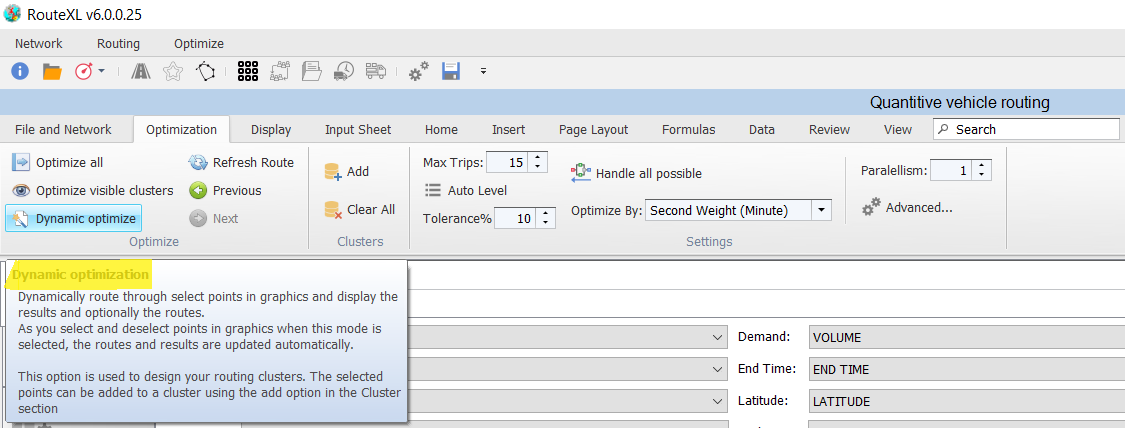
❖You would display your points and/or routes by going to the Display tab and selecting appropriately.


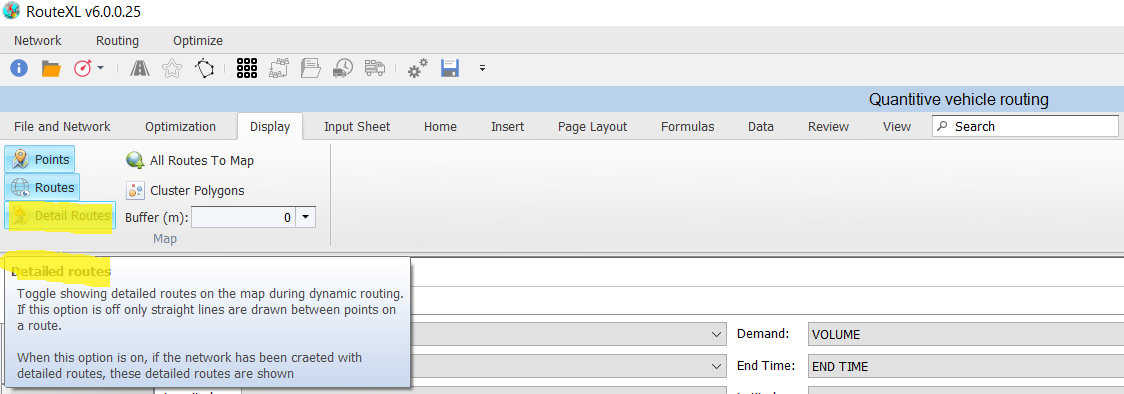
❖You can build your own clusters per the description of Dynamic optimize by adding them or removing them:


❖You are also able to Refresh Route if necessary when using Dynamic optimize:

❖Undo and redo options exist in this Optimization tab as well.


❖Once you’ve chosen your way of optimization and run it to a solution, your results will be displayed in the Results tab in your Grid.
In my example I have Pools that have been assigned to Clusters, so I have used the Optimize all option. (Note: It is best to have Pools and Clusters set up, even if it just one Pool and one Cluster. You will have an additional tab next to Grid called Summary which shows whether you got a solution or not and adjust whatever is needed to get a solution. This saves time.)
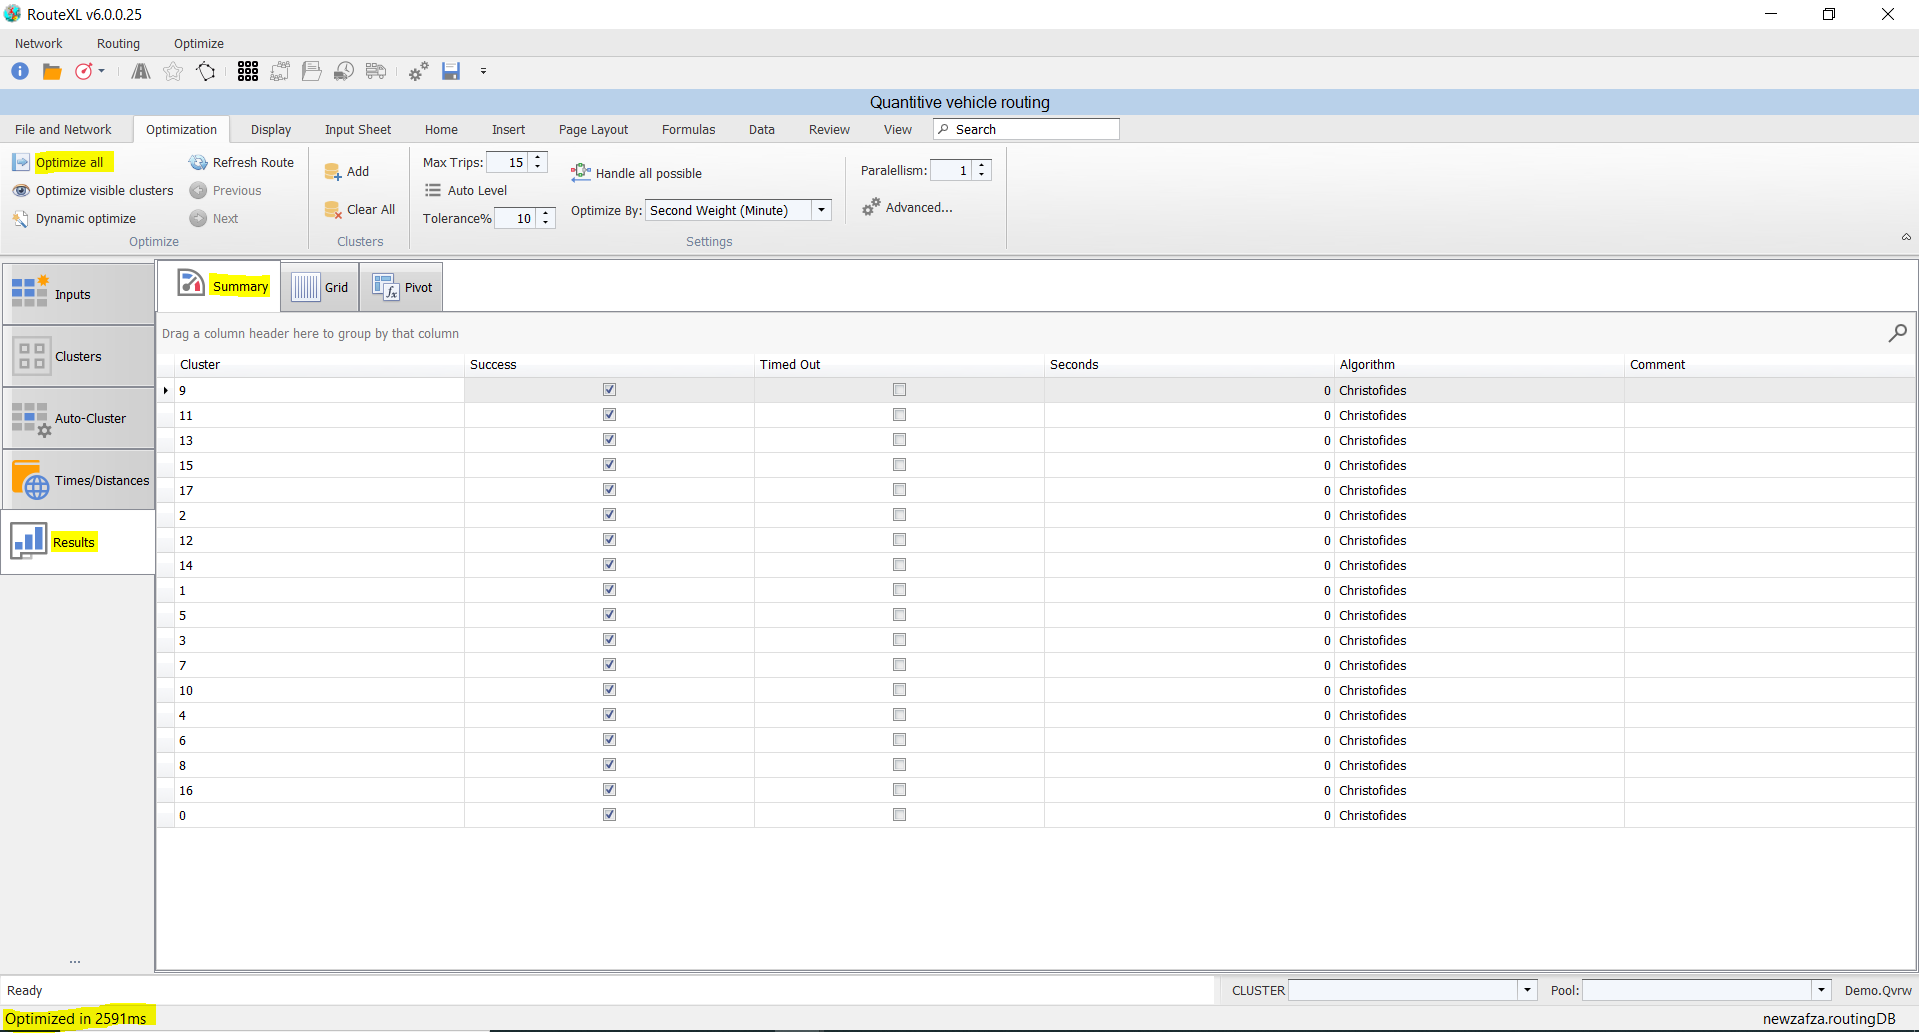
❖You can see that a solution was found for all clusters by a tick in the Success column. If there was no success it wouldn’t be ticked. The Timed Out column has nothing ticked on showing all clusters solved within the timeout set in the Advanced button described above. If there was no solution (because you have a lot of points in a cluster to solve) it may timeout before a solution is found. Timed Out would be ticked on. In this case you can just adjust your timeout to a higher number to allow enough time for a solution to be found and rerun.
The Seconds column shows how long it took for that Cluster to solve. The Comment column will display an error message against a cluster if there was no solution because of various reasons like capacity of the truck is too low to carry the volume needed to be delivered to a customer etc. You therefore can adjust your inputs and rerun the solution.
If your Comment column simply just reports No Solution against a cluster/s, it usually means that your Shift time is too low, or your number of Instances are too low. There could be other reasons so just ensure your inputs are 100% correct. You then need to rerun.
❖Your actual results are in the Grid tab.
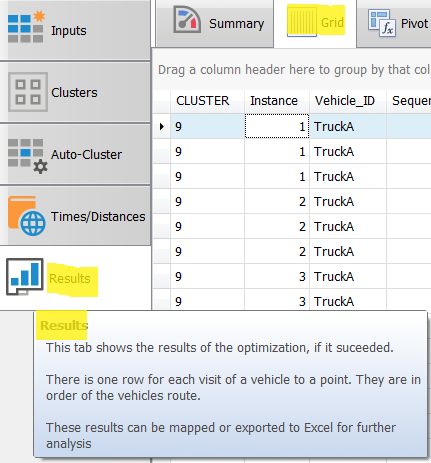
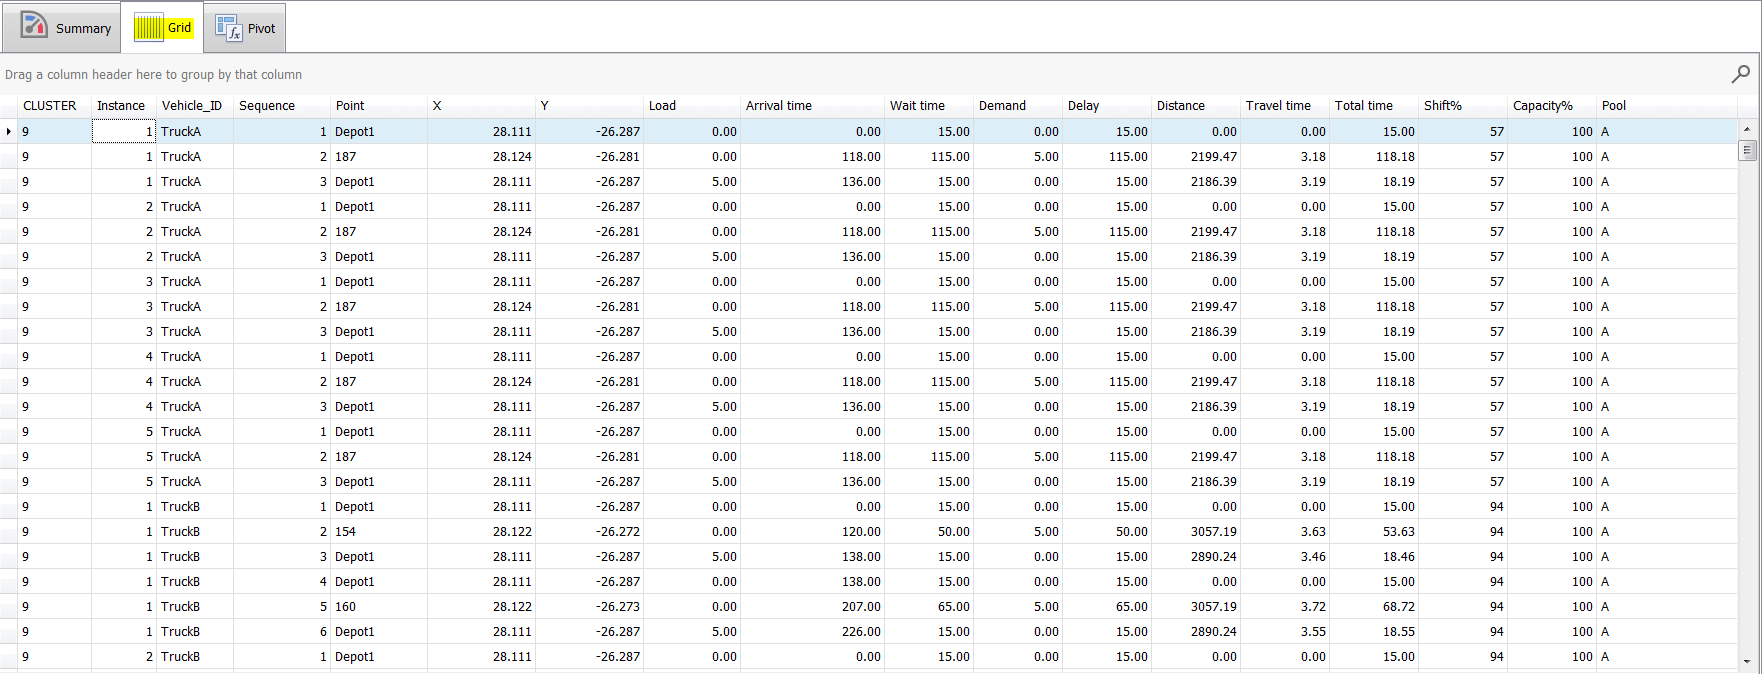
❖These results are self-explanatory by the column names. All your various parameters that have been set resulted in optimized delivery per above.
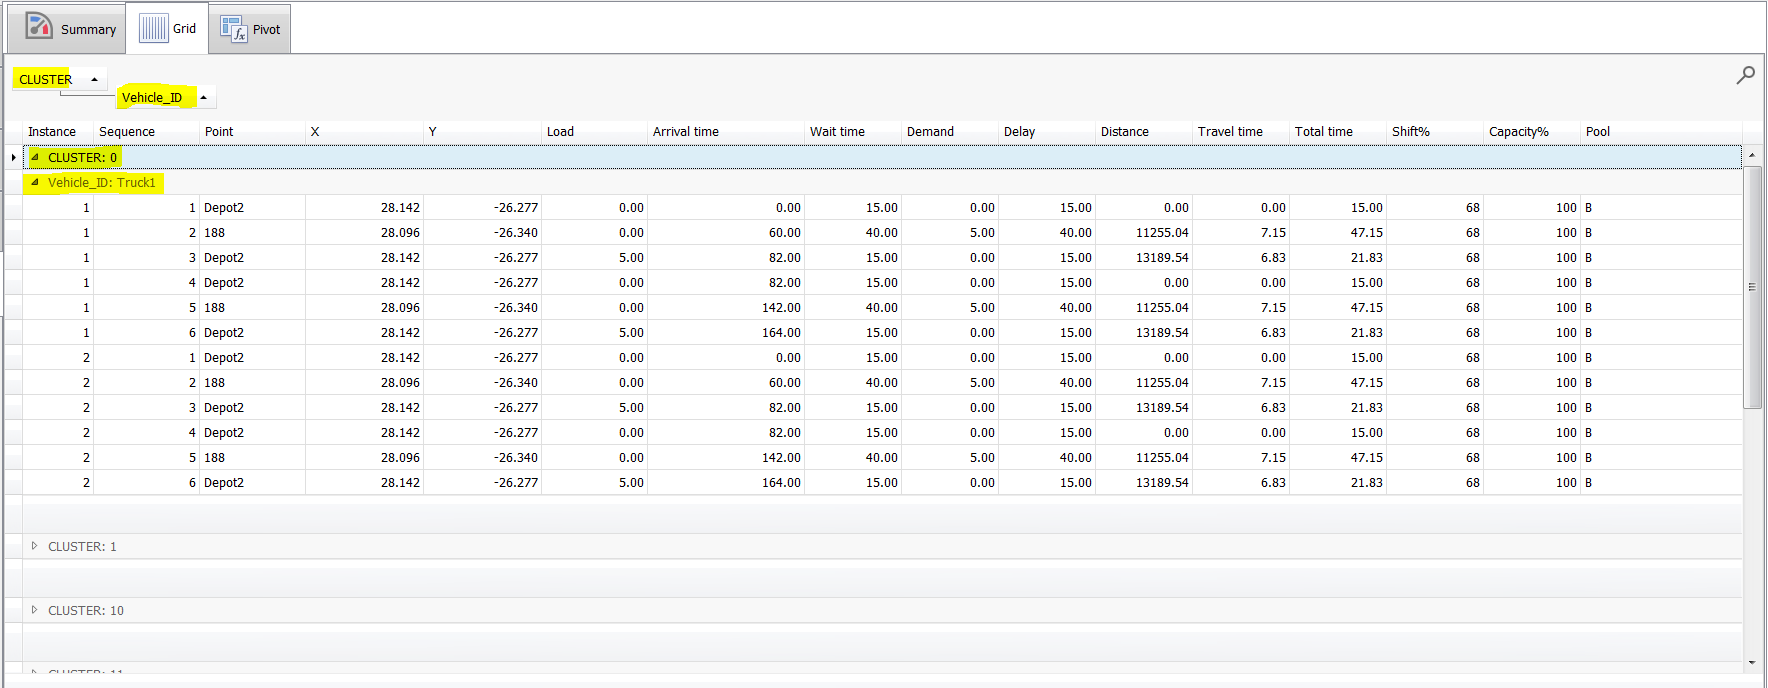
❖You can also group by columns to see you results clearer per the below:

ADVANCED SECTION
❖There is an option of clustering your points radially using Auto-Cluster in QVR. In this case you need to set up a blank Cluster column in your Points sheet so your cluster numbers can populate there. The number of clusters created depends on your Shift Time in your Vehicles sheet. The shorter the shift time the more clusters will be created that fits the shift time. (I used 60 min as an example)
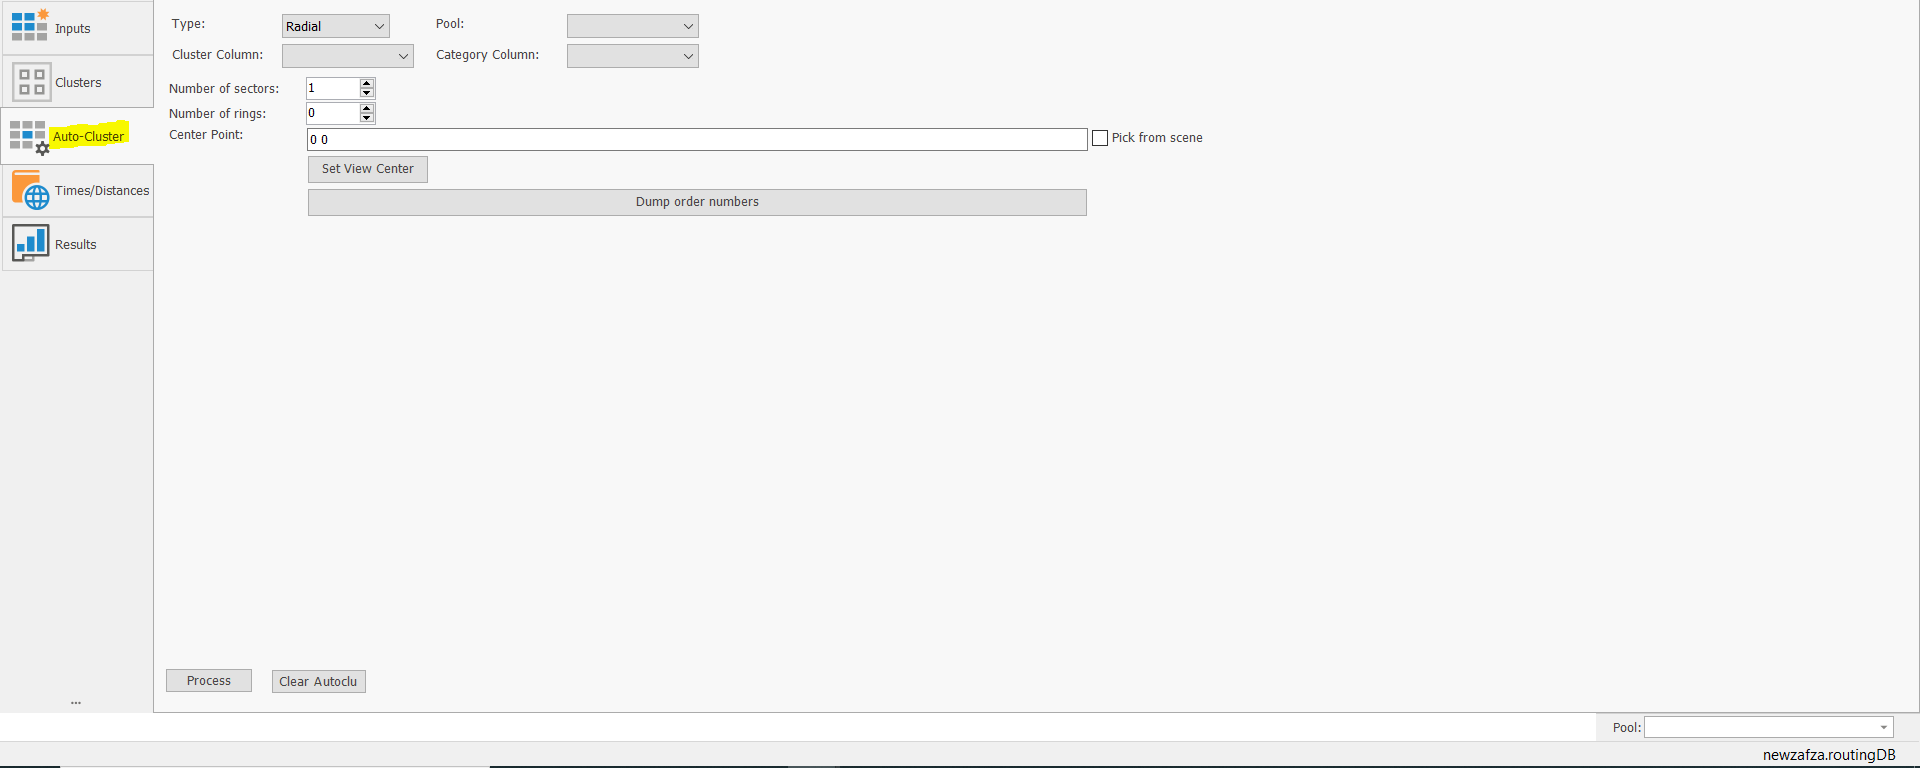
❖Then set up your fields as below:
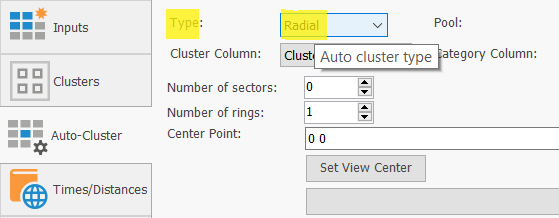


(This as a default works well. You can adjust as necessary)

(This as a default works well. You can adjust as necessary)


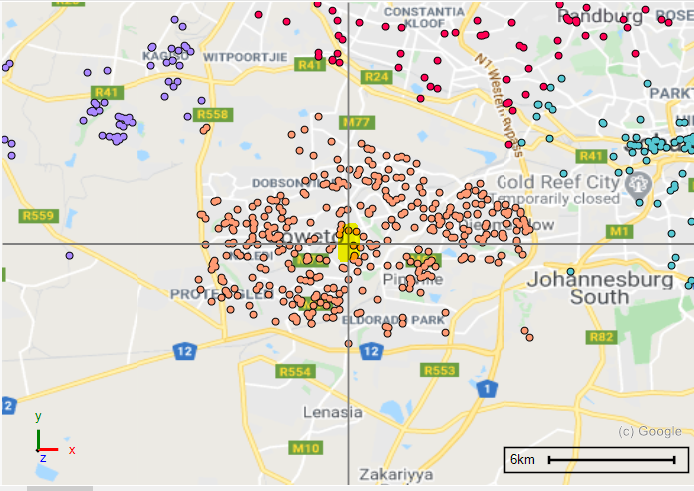
(You would usually have your crosshair centred where your depot would be.)
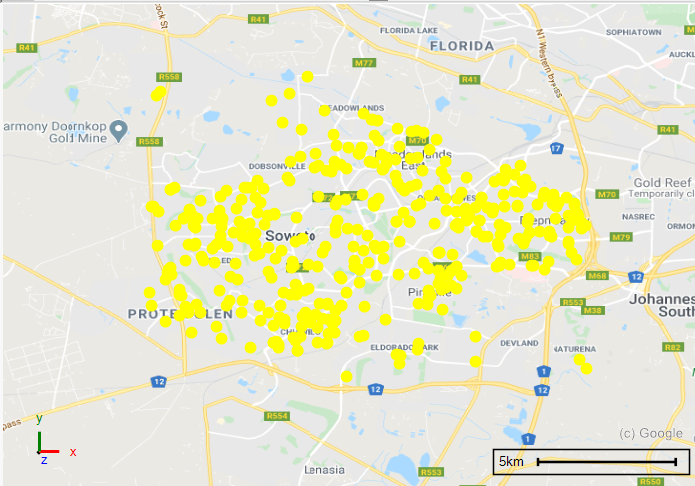
❖Go to your Display tab and select Points. (A QVRW Points layer will be added.) Use a selection tool and select the points on your map you are wanting to radially cluster.
❖Click on Process. You will see at the bottom left of your window when it is complete.
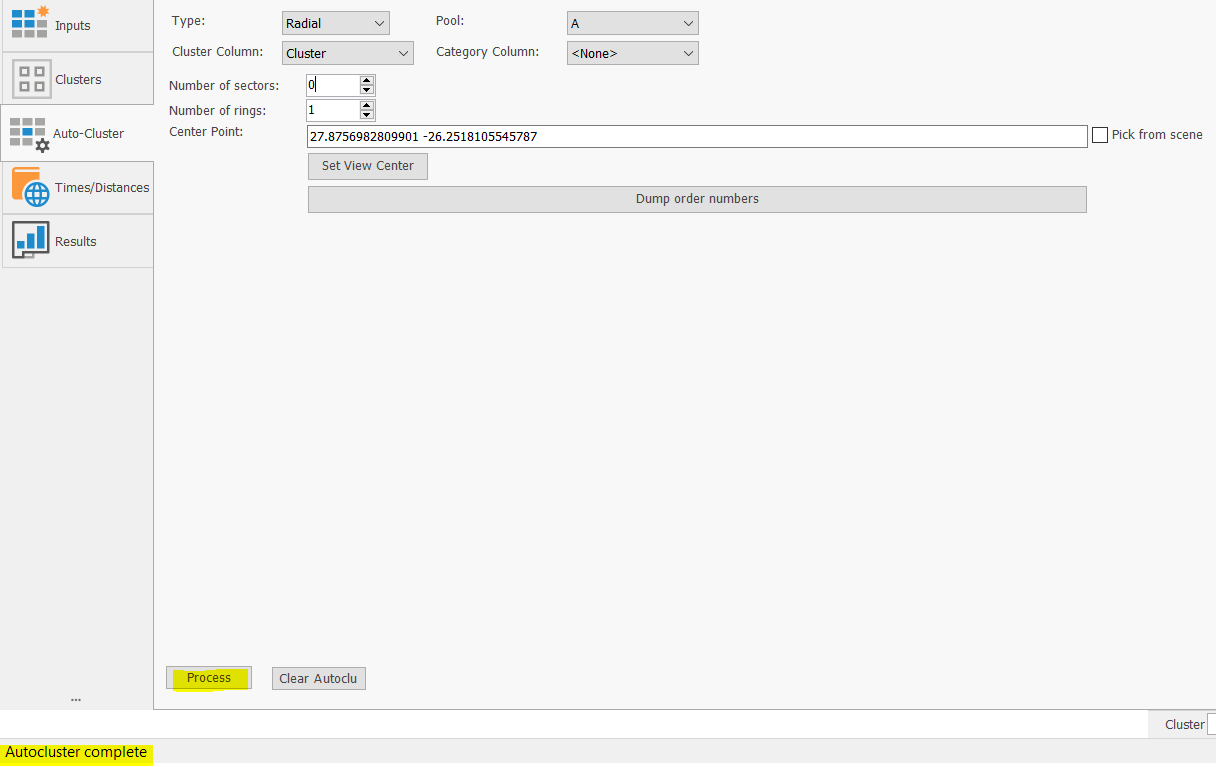
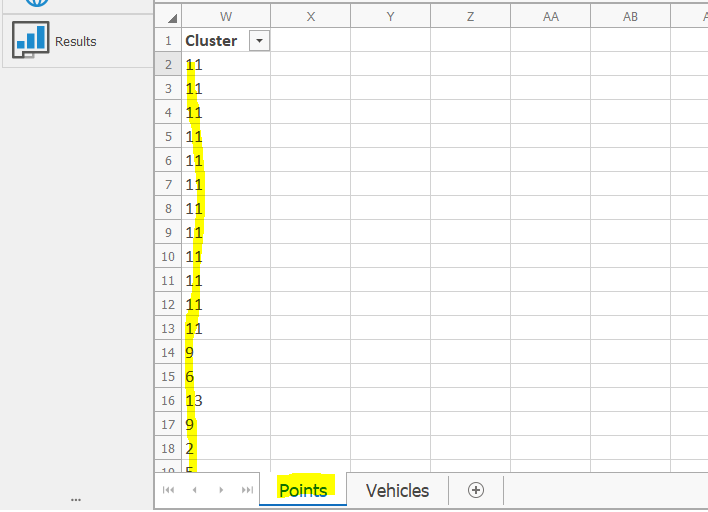
❖Your cluster numbers are populated in your Cluster column in your Points sheet.
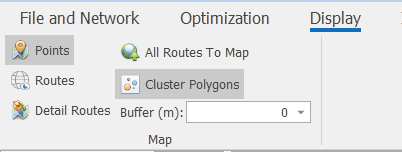
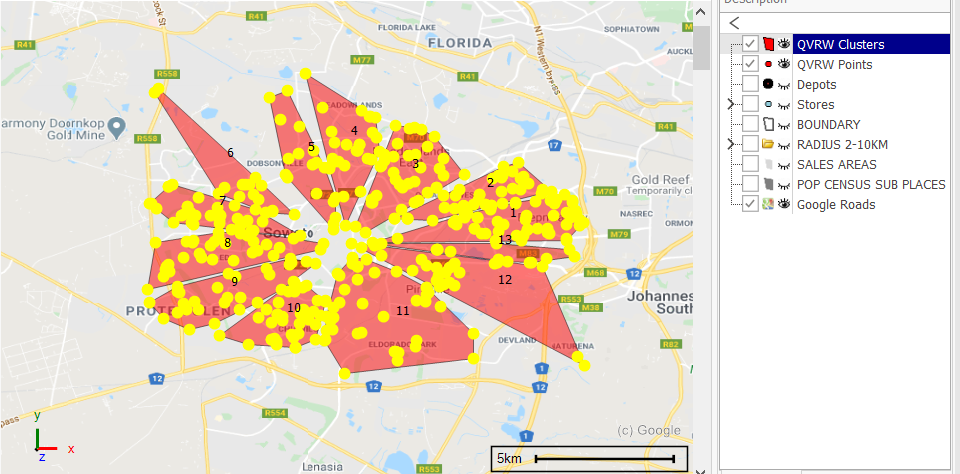
❖Click on Cluster Polygons in your Display tab to see your polygons drawn on your map.
❖A QVRW Clusters layer will be added where you can view your data etc. 13 clusters were drawn in this example.
❖There is also an option of Dumping order numbers if that is needed.

Support
|
||||||
|
T: +27871354351
|
|||||
