White Paper: Leveraging QubeXL, RouteXL, and SpatialXL for Cost to serve (CTS)
White Paper: Leveraging QubeXL, RouteXL, and SpatialXL for Cost to serve (CTS)
An integrated approach to scalable, automated Cost-to-Serve (CTS) modeling and geographic insight
Executive Summary
Cost-to-Serve (CTS) is a critical metric for organizations aiming to optimize logistics, distribution, and warehousing costs while protecting profitability at both customer and SKU level. This white paper describes how QubeXL, RouteXL, and SpatialXL work together to deliver a robust, automated, and scalable CTS capability—able to process millions of data points, refresh frequently (e.g., monthly or weekly), and support near real-time decision-making through analytics and mapping.
1. Introduction
CTS measures the end-to-end cost incurred to deliver a product from the point of production (or primary warehouse) to the customer. It typically includes distribution centre handling, storage, picking, loading, transport, and related operational overheads, while excluding marketing and sales costs. A well-designed CTS model enables organizations to:
- Make informed logistics and distribution decisions using cost and margin transparency.
- Identify primary cost drivers (e.g., distance, order size, handling intensity, service frequency).
- Perform scenario planning (e.g., depot changes, route redesign, fleet resizing, customer segmentation).
- Support strategic route-to-market (RTM) choices, including service policies and network redesign.
2. Evolution of CTS Modeling
The evolution of CTS modeling has progressed from manual spreadsheet approaches to automated, data-driven systems:
- Manual, Excel-based models: Often relied on aggregates and averages, were slow to refresh, and were difficult to audit. Granularity (customer × SKU × warehouse) was limited by performance and data preparation effort.
- Semi-automated models: Introduced ETL routines and better cost allocation logic, but still struggled with scale and repeatability, and frequently required specialist intervention to refresh.
- Modern automated CTS platforms: Use scalable data structures, standardized drivers, and direct ERP integration to deliver repeatable CTS outputs at customer and SKU level—with faster refresh cycles and improved governance.
QubeXL, SpatialXL , and RouteXL together enable this modern approach by combining high-volume techno-financial modeling (QubeXL) with spatial insight and routing analytics (SpatialXL + RouteXL), creating a CTS solution that is both operationally accurate and decision-ready.
3. Technology Stack Overview
The integrated CTS stack separates concerns: calculation and allocation at scale, route/distance realism, and geographic interpretation of results.
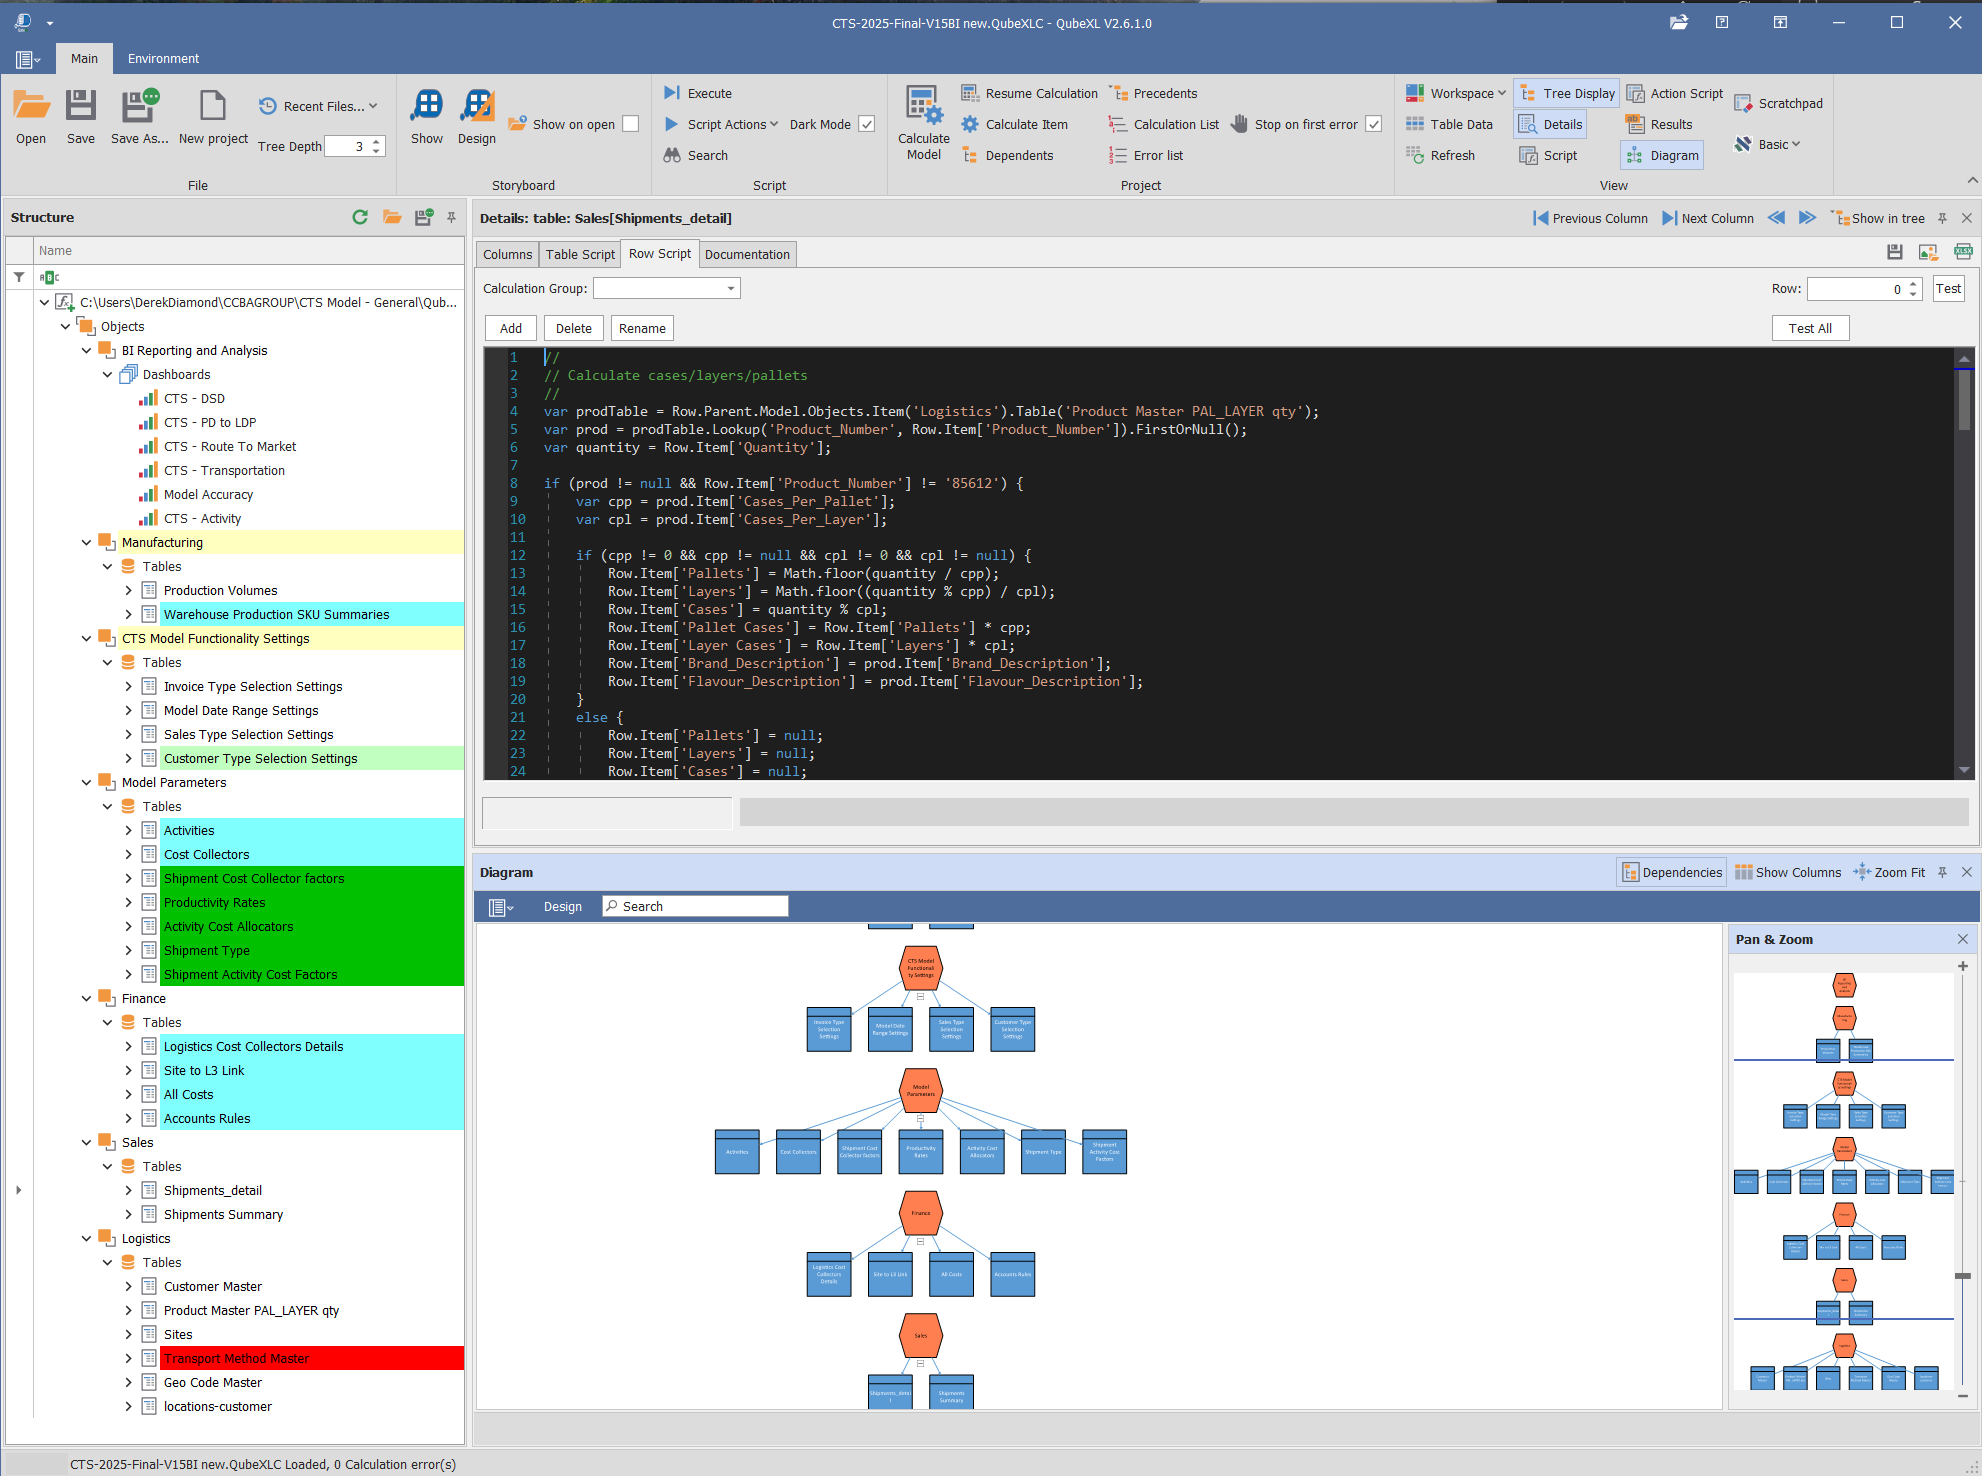
3.1 QubeXL
QubeXL is a techno-financial modelling tool designed to handle large, hierarchical datasets efficiently. Using hierarchical data frames, it can process millions of rows while maintaining clear parent-child relationships (e.g., Warehouse → Shipment → Customer → SKU). This makes it suitable for repeatable CTS allocation runs, auditability, and integration with ERP and operational data feeds.
3.2 SpatialXL
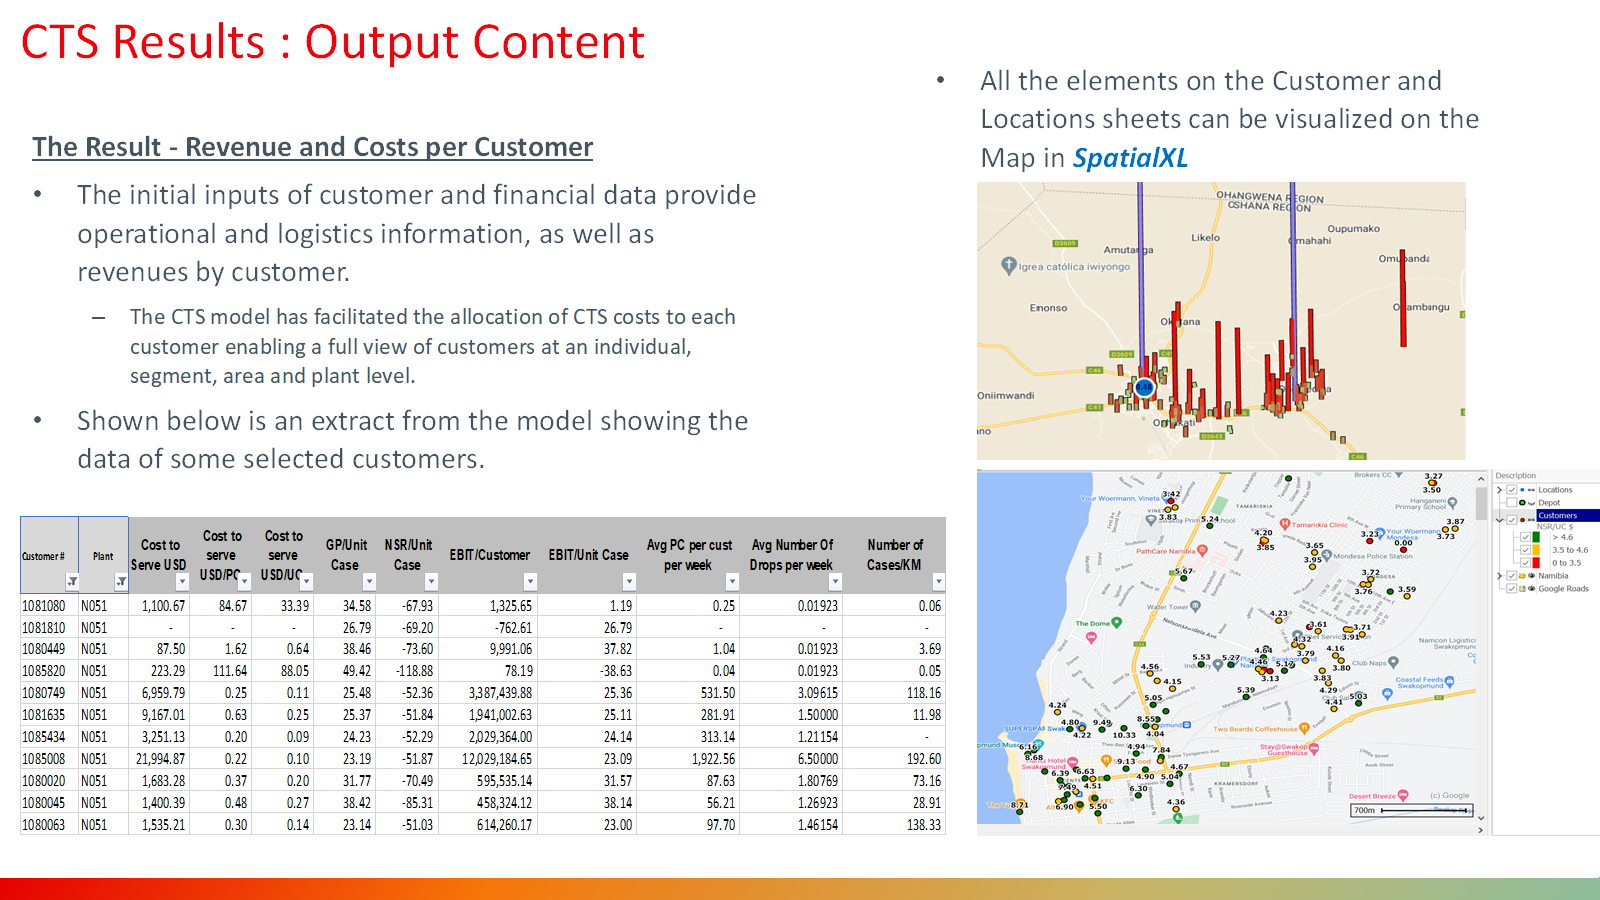
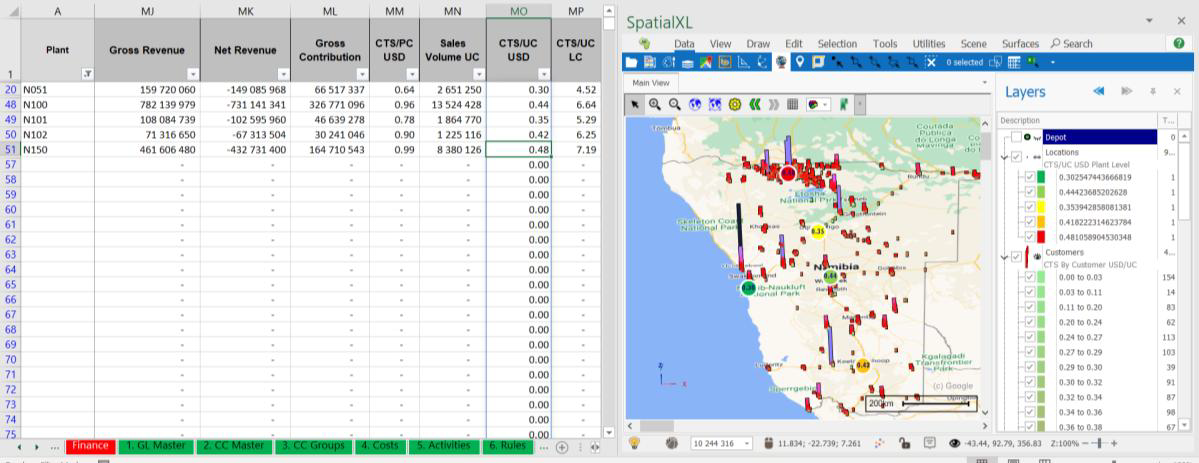
SpatialXL is an Excel-based spatial analytics and mapping tool used to visualize CTS outputs geographically. It allows thematic mapping (e.g., high CTS per case, cost per kilometre, service frequency), supports regional segmentation, and helps stakeholders quickly interpret where costs concentrate across depots, routes, and customer clusters.
3.3 RouteXL
RouteXL is an add-in for SpatialXL that provides drive-time and distance analysis, routing optimization, and matrix calculations. It is used to replace straight-line assumptions with realistic road-network measures, and to test how routing and service-policy changes affect transport cost and customer economics.
3.4 How the tools work together
- RouteXL calculates realistic distance/time (and optional route designs) between depots and customers.
- QubeXL consumes activity volumes, cost pools, and distance/time outputs to allocate costs down to customer and SKU level.
- SpatialXL visualizes CTS outcomes geographically, enabling rapid validation and stakeholder insight.
4. CTS Calculation Framework
The CTS framework typically follows a modified Activity-Based Costing (ABC) approach. Operational costs are grouped into cost collectors (cost pools), then allocated to activities and objects (warehouse, shipment, customer, SKU) using measurable drivers. The objective is to reflect how resources are actually consumed (handling touches, distance travelled, time on road, etc.).
| Cost collector | Typical costs included | Common drivers |
|---|---|---|
| Direct | 3PL invoices, tolls, fuel pass-throughs, outsourced services | Shipment count, distance, weight/volume, service type |
| FTE | Labour costs for receiving, put-away, picking, loading, admin | Cases, pallets, order lines, touches, time standards |
| Forklift / MHE | MHE depreciation/lease, maintenance, charging, operator time | Pallet moves, layers, picks, dock-to-stock movements |
| Truck (fleet) | Vehicle fixed + variable costs (lease, maintenance, tyres, fuel) | Kilometres, drive time, drops, cube utilization, route time |
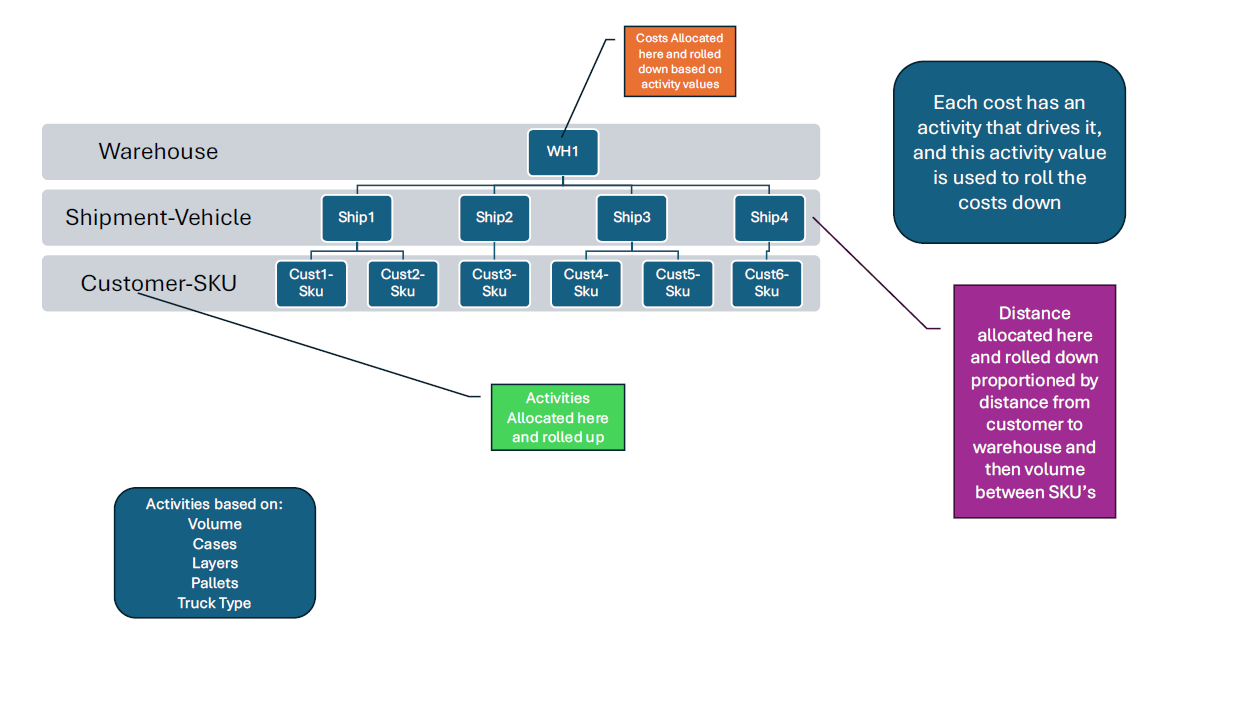
Roll-down allocation logic ensures costs are assigned consistently from higher-level operational entities to the final CTS objects:
- Warehouse → Shipment: Allocate site-level costs to shipments using activity volumes (e.g., pallets handled, cases picked).
- Shipment → Customer: Allocate shipment-level transport and handling costs to delivery points using drops, distance/time, and delivery complexity.
- Customer → SKU: Allocate customer delivery costs to SKUs using volume/case equivalents, weight, cube, or line-level measures.
5. Real-World Application: CCBSA Implementation
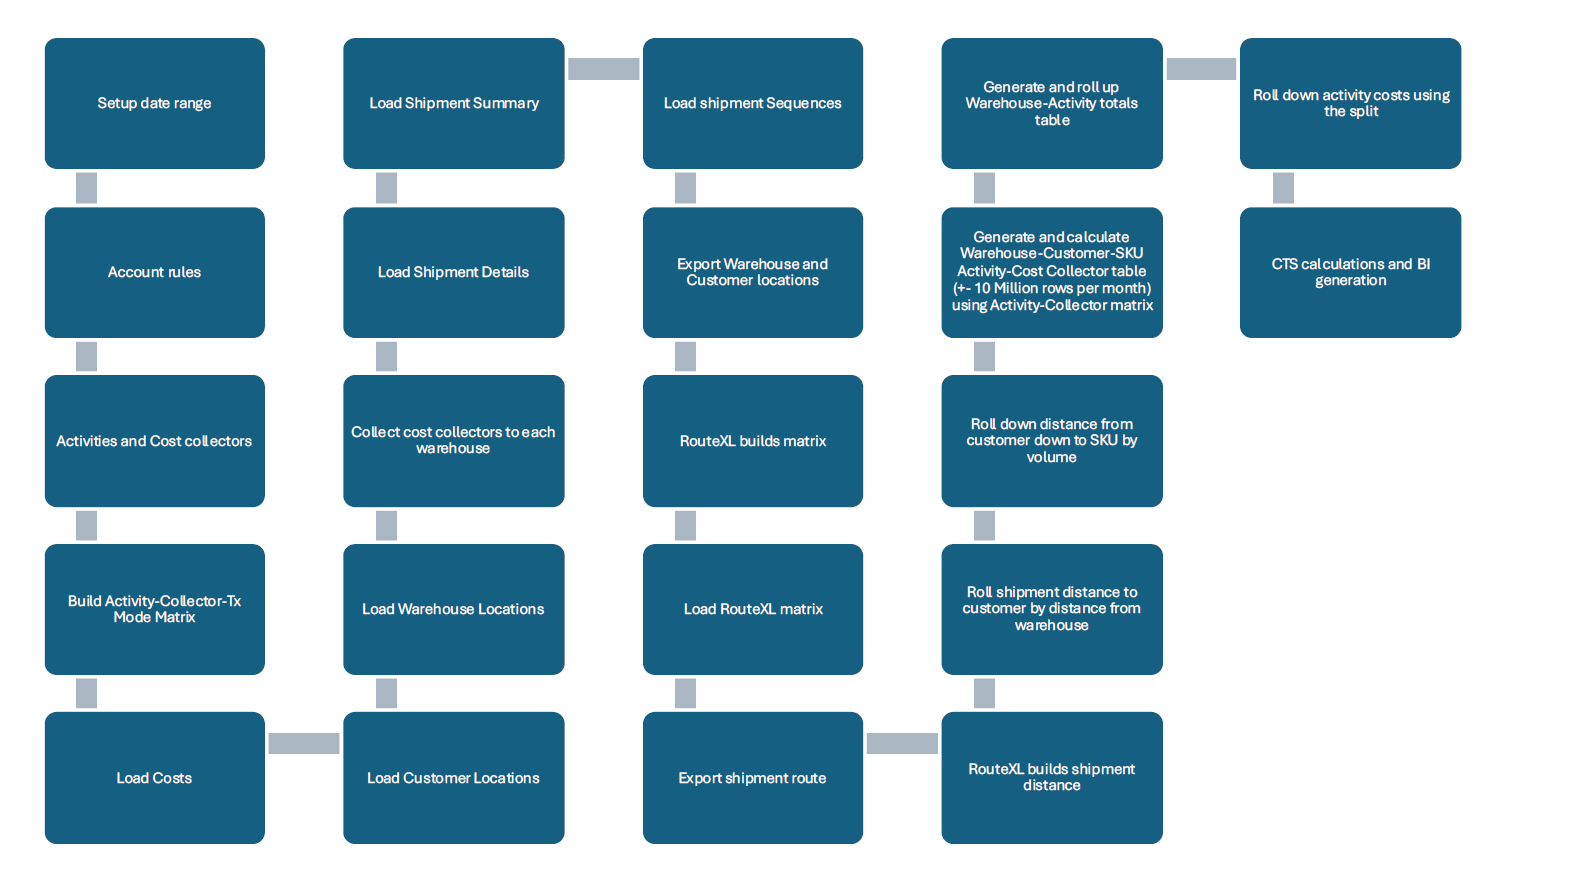
In a real-world implementation for CCBSA, an automated CTS model integrated with a D365 ERP environment was designed to compute CTS at Warehouse–Customer–SKU level with high operational fidelity and strong auditability.
- Scale: Approximately 11 million rows per month in activity-cost tables, refreshed on a repeatable cadence.
- Integration: Operational volumes and financial actuals sourced from ERP, standardized into QubeXL hierarchical frames for allocation.
- Transport realism: RouteXL-supported distance/time matrices and route scenarios provided more accurate fleet and routing cost outcomes.
- Decision support: Near real-time scenario planning supported route optimization, fleet sizing, and service-policy testing (e.g., drop density improvements and delivery frequency changes).
6. Monitoring and BI
QubeXL produces consolidated CTS outputs by cost collector, warehouse, customer, route, and SKU. These outputs can be published into standard reporting layers for performance monitoring and governance.
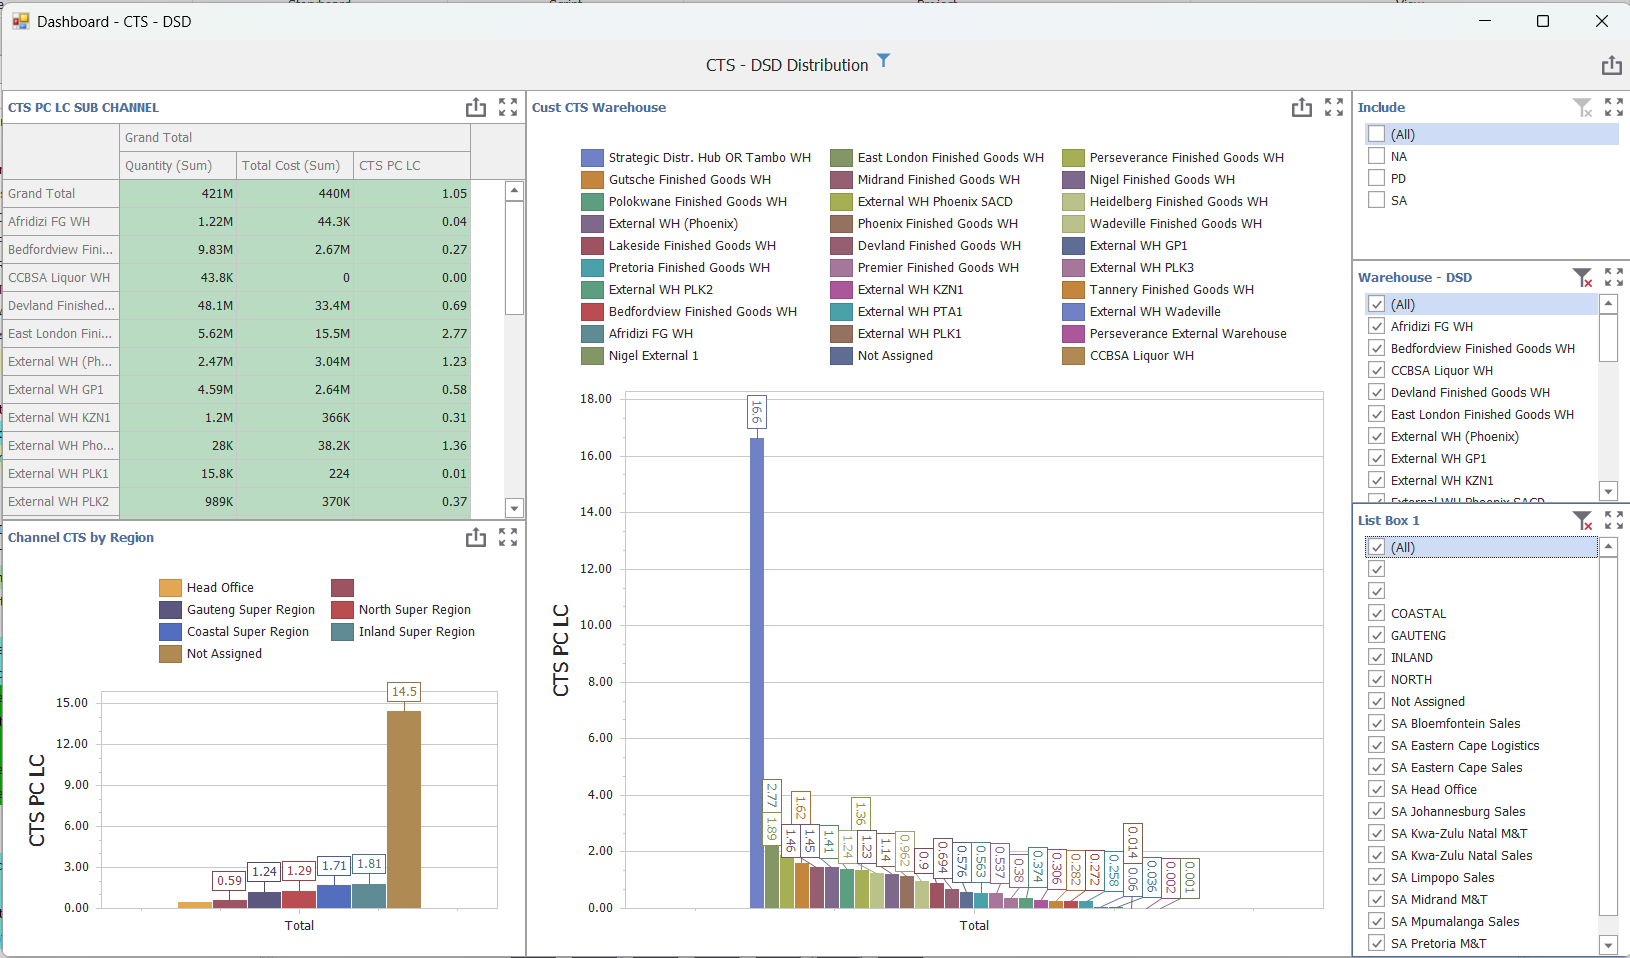
- Power BI dashboards: Management views of CTS per case/pallet, distribution margin waterfalls, top cost drivers, and exception lists (e.g., loss-making customers, uneconomical SKUs).
- SpatialXL thematic layers: Geographic overlays highlighting high-cost-to-serve customers, regional cost hot-spots, and opportunities to improve drop density or depot assignment.
- Controls: Reconciliation checks against financial actuals and operational totals to ensure model credibility and repeatability.
7. Future Enhancements
As organizations mature their CTS capability, the following enhancements can extend accuracy, responsiveness, and strategic value:
- AI-driven predictive CTS: Forecast CTS impacts of demand shifts, new customers, and service-policy changes using historical patterns and operational constraints.
- IoT and telematics integration: Improve transport cost accuracy with near real-time signals for kilometres, idling, temperature control events, and dwell time.
- Advanced simulation for RTM: Evaluate network redesign, depot placement, fleet mix, and delivery frequency scenarios with robust constraints and sensitivity analysis.
- Automated anomaly detection: Flag sudden CTS spikes by customer/SKU/route for faster root-cause analysis.
Conclusion
The integration of QubeXL, RouteXL, and QubeXL transforms CTS from a static, manual exercise into a dynamic, automated, and strategic capability. By combining scalable allocation logic, realistic routing and distance analytics, and intuitive spatial visualization, organizations gain timely visibility into cost drivers, can optimize logistics and service policies, and can improve profitability at scale—down to the customer and SKU.
SpatialXL and QubeXL Output